Gantt Chart Software for Agile Teams: Does It Fit?
July 31, 2026PUBLISHED INAgile
 ali
ali 2026-07-31 18:05:00
 0
0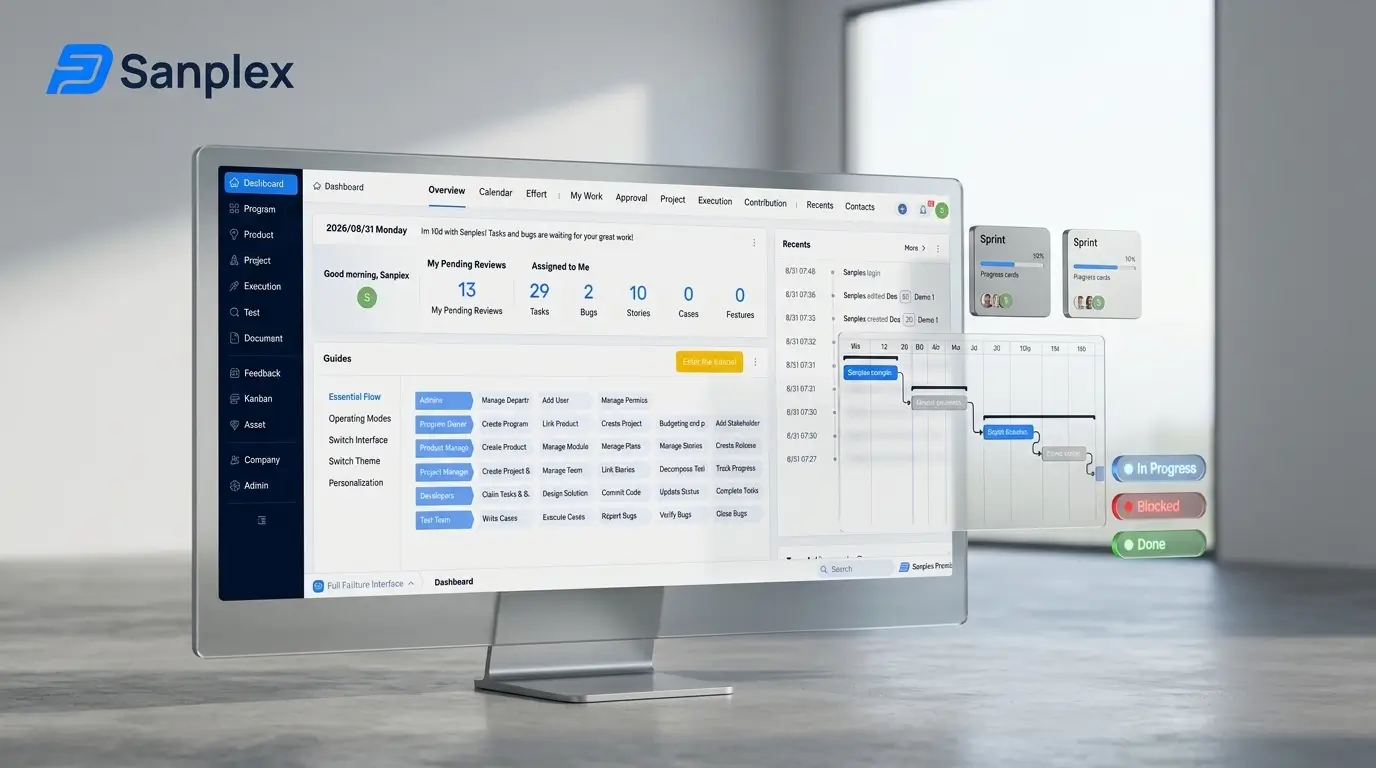
The Gantt chart has an image problem in agile circles, and some of it is deserved. A bar chart that fixes every task's start and end date months in advance is a direct contradiction of empirical process control. If your Gantt chart is a plan you defend rather than a model you update, it is doing damage.
But the objection is usually aimed at a specific misuse rather than at the artifact. Gantt charts encode two things that agile boards genuinely do not — dependencies between work items and their position in calendar time — and both matter the moment more than one team has to coordinate. This article covers where Gantt charts still earn their place on agile teams, where they should not be used, and what to look for in tooling.
What a Gantt chart actually encodes
Strip away the association with waterfall and a Gantt chart is a data structure with four elements:
• Duration — how long a piece of work is expected to take.
• Sequence — its position on a calendar.
• Dependency — which work must finish before it can start.
• Critical path — the chain of dependent work that determines the earliest possible completion date.
That last one is the reason the format survives. A Kanban board tells you what is in progress. A burndown chart tells you whether the sprint is on track. Neither tells you that a two-day delay in an authentication service will push a launch by three weeks because four other pieces of work sit behind it.
|
Agile boards answer "what are we doing now?" Gantt charts answer "what happens to the date if this slips?" Those are different questions, and mature teams need both. |
Where Gantt charts genuinely break agile
Be specific about the failure modes, because "Gantt is not agile" is too blunt to be useful.
Task-level scheduling inside a sprint. Assigning start and end dates to individual tasks within a two-week iteration is waste. The team self-organises daily; a schedule fixed at sprint planning is stale by Wednesday. Use the board.
Estimates hardening into commitments. The moment a bar on a chart becomes a date that stakeholders quote back, the team starts padding estimates and the chart starts lying in both directions. This is a governance failure, not a tooling one, but the artifact makes it easy.
False precision far out. A bar that says a feature runs from 14 October to 3 November, nine months from now, is fiction rendered at high resolution. The rendering is the problem — it looks like knowledge.
Replacing the backlog. A Gantt chart is not a prioritised list. Backlog order changes constantly on healthy teams; a chart that has to be re-baselined for every reprioritisation will simply stop being updated.
Resource levelling as a planning tool. Optimising individual utilisation across a chart pushes towards specialisation and hand-offs, which is the opposite of cross-functional team design.
Four situations where it earns its place
1. Cross-team dependency coordination
This is the strongest case. Within a single team, dependencies are managed in conversation. Across six teams delivering into one release, they are not. A dependency map on a timeline shows which team is blocking which, when the handoff is expected, and how much float exists before the date moves.
Scaled agile frameworks recognise this — a programme board with dependency strings between teams is a Gantt chart in different clothing.
2. Fixed-date external commitments
Some dates are not negotiable: a regulatory deadline, a contractual delivery, a trade show, a hardware launch, the end of a support window. Agile controls scope against a fixed date; it does not make the date flexible. Working backwards from an immovable date through dependent work is exactly what the critical path is for.
3. Hybrid and stage-gated delivery
Plenty of organisations run agile software development inside a waterfall programme — manufacturing, automotive, medical devices, defence, construction-adjacent engineering. Hardware has lead times that no amount of iteration removes. The programme layer is scheduled and gated; the software layer is iterative. Both need to be visible, and the interface between them is a timeline.
4. Release and milestone planning above the sprint
Sprints are the wrong unit for a stakeholder asking when a capability lands. A release-level view showing epics, milestones, and dependencies across a quarter or two is legitimate forward planning — provided it is maintained at epic granularity rather than task granularity.
Roadmap or Gantt?
A common objection: "we already have a roadmap." They are different artifacts. A product roadmap communicates intent and sequence — usually themes in time buckets, deliberately imprecise. A Gantt chart models dependency and duration to produce a completion date. Roadmaps are for stakeholders; Gantt charts are for planners. Substituting one for the other loses either the dependency logic or the strategic framing.
Rules for using Gantt without waterfall-ing your team
If you adopt one, adopt these constraints with it:
1. Plan at epic or feature level, never task level. Bars represent things that take weeks, not hours.
2. Precision decays with distance. The next six weeks can be scheduled. The following quarter is a sequence, not a set of dates. Show that visually.
3. The team owns the board; the programme owns the chart. Do not ask developers to maintain both. The chart should derive from work item data automatically.
4. Re-baseline on a fixed cadence. Once per iteration or once per month. A chart re-baselined continuously is unfalsifiable; one never re-baselined is fiction.
5. Show dependencies, not just bars. A Gantt chart without dependency lines is a calendar. The dependencies are the entire value.
6. Track float explicitly. Which chains have slack and which do not is the actionable output.
7. Never present a bar as a commitment without a stated confidence. "Mid-November, medium confidence" is honest. "12 November" is not.
Gantt versus the alternatives
|
Artifact |
Answers |
Granularity |
Weakness |
|
Kanban / Scrum board |
What is in flight now |
Task |
No calendar, no dependencies |
|
Burndown / burnup |
Are we on track this sprint |
Sprint |
Single team, single iteration |
|
Cumulative flow diagram |
Where work is queueing |
Workflow state |
Diagnostic, not predictive of dates |
|
Product roadmap |
What we intend to build and roughly when |
Theme / epic |
Deliberately imprecise; no dependency logic |
|
Gantt chart |
When will it finish and what blocks it |
Epic / feature |
Invites false precision; needs maintenance |
|
Monte Carlo forecast |
Probability distribution of completion dates |
Backlog |
Requires throughput history; less intuitive |
The mature answer for a multi-team organisation is usually boards at team level, a Gantt or dependency view at programme level, and probabilistic forecasting to sanity-check the dates the Gantt produces.
What to look for in Gantt chart software
For agile teams specifically, the requirements are narrower than a generic project scheduling tool:
• Derived from work items, not entered separately. If the chart is a second data set someone maintains, it will diverge. Bars should be epics, features, and phases that already exist in the tracker.
• Drag-and-drop rescheduling with dependent items moving automatically.
• Real dependency types, not just visual arrows — finish-to-start at minimum, with lag.
• Critical path highlighting and visible float.
• Milestones as first-class objects, since fixed dates are the usual reason the chart exists.
• Baseline comparison so you can see planned against actual rather than only the current plan.
• A view that scales across products, if you run more than one product line.
Tooling reality: Jira has no native Gantt chart. Timeline and Advanced Roadmaps cover parts of the need depending on tier, and full Gantt capability is typically a Marketplace app such as BigGantt or Structure — which, under Atlassian's tier-matching rule, must be licensed to your entire Jira user count rather than to the handful of programme managers who use it. That pricing asymmetry is why Gantt apps show up so often in app-spend audits.
Sanplex includes Gantt charts in the product rather than as an add-on, at both project-phase and task level, with drag-and-drop scheduling, dependency mapping between tasks and sprints, and milestone tracking. Because it supports Scrum, Kanban, Waterfall, and hybrid modes within the same platform and layers a program tier above projects, the Gantt view sits over the same data the boards use rather than in a parallel system. Gantt charts are available from the Standard tier; the pricing page carries current details.
Frequently asked questions
Do agile teams use Gantt charts?
Many do, but at a different level than traditional project management. Agile teams typically use boards for sprint-level work and Gantt charts at the programme or release level to model cross-team dependencies, fixed external dates, and milestone planning.
Is a Gantt chart compatible with Scrum?
Yes, provided it is used above the sprint. Scheduling individual tasks inside an iteration conflicts with team self-organisation, but a release-level Gantt showing epics, milestones, and cross-team dependencies does not conflict with Scrum practice.
What is the difference between a Gantt chart and a product roadmap?
A roadmap communicates intent and rough sequencing to stakeholders, usually in time buckets without precise dates. A Gantt chart models durations and dependencies to calculate a completion date and a critical path. They serve different audiences.
Does Jira have a Gantt chart?
Not natively. Jira provides timeline and roadmap views, with capability varying by plan tier, and full Gantt functionality generally requires a Marketplace app. Because Atlassian apps must be licensed at the host product's full user tier, a Gantt app used by a few planners is billed against every Jira user on the site.
What should replace a Gantt chart for a single agile team?
For one team, a Kanban or Scrum board plus a burndown chart covers day-to-day flow, and Monte Carlo forecasting from throughput history gives better completion estimates than a bar chart. Gantt charts start earning their keep when multiple teams share dependencies.
How often should an agile Gantt chart be updated?
Automatically and continuously if it derives from work item data, with a formal re-baseline once per iteration or once per month. Manual charts updated ad hoc go stale quickly and lose credibility.
Related Blogs
Best Zephyr Alternatives for Test Case Management in 2026