Catalog
1. Gain reports and dashboards with a powerful search function
1.1 In Jira
When you use the Jira search you could get the List view or Detail view. You can switch between:
- List view: Shows your search results as a list of issues. This view is easiest to scan and is best when you only need to know a few details about each issue.
- Detail view: Shows your search results as a list of issues, with the right panel showing the details of the currently selected issue.
1.2 In ZenTao
Zen Tao's home page has a global search function. It can support multiple sets of conditions to search according to keywords. (Including conditions such as name, status, description, person in charge, creation date, etc.) There are separate search boxes on the Programs, Products, Requirements, Implementation, Bugs, Use Cases, Feedback, Academy, and User pages. The search results cover each keyword.
2. Gain key project insights with Advanced Search and JQL
2.1 In Jira
Jira Query Language (or JQL) is one of the most powerful tools available in Jira. The system uses the following data to filter issues. And, in turn, helps you find what you’re looking for much faster:
- Fields
- Operators
- Values
- Keywords
- Functions
Searching and exporting using JQL is actually a report-assisted function. You can set various conditions to obtain the results you want. In fact, you still need to manually define the search conditions and the results you want to search.JQL still needs a certain learning cost.
2.2 In ZenTao
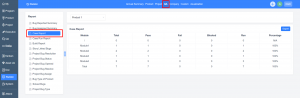
Some commonly used reports have been built in Zen Tao. ZenTao can summarize and analyze the data in the system to generate reports. At the same time, ZenTao supports exporting the reports to the local computer and also supports the custom reports. In the "Statistics" section, ZenTao summarizes data from products, projects, QA, and the company, then presents the data in multiple dimensions through reports. The product-related reports, project-related reports, and QA-related reports can be viewed in ZenTao Opensource Series, there is no further elaboration. As for the custom report, we will discuss it in the next chapter.
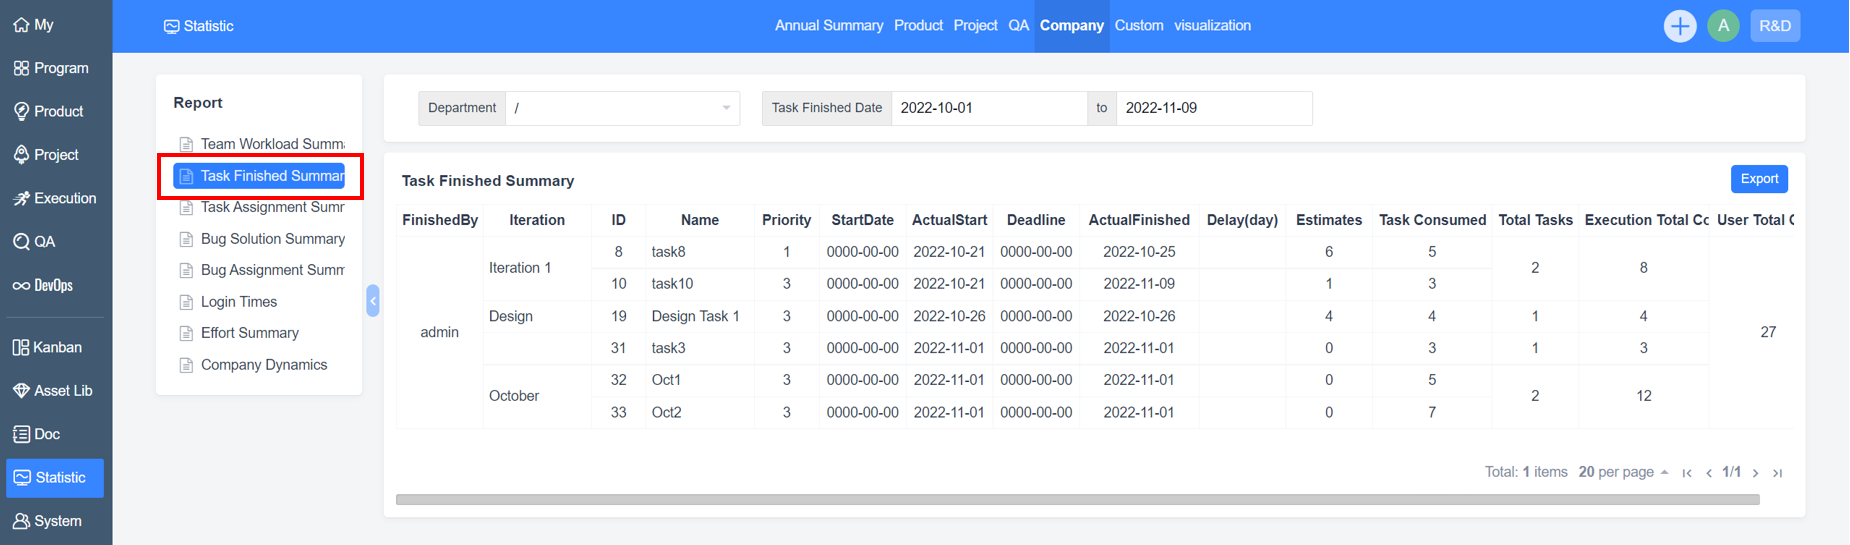
Task Finished Summary
The Task Finished Summary in "Statistics" - "Company" allows you to count the status and hours cost of all tasks over time.
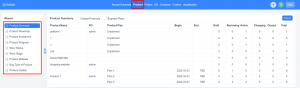
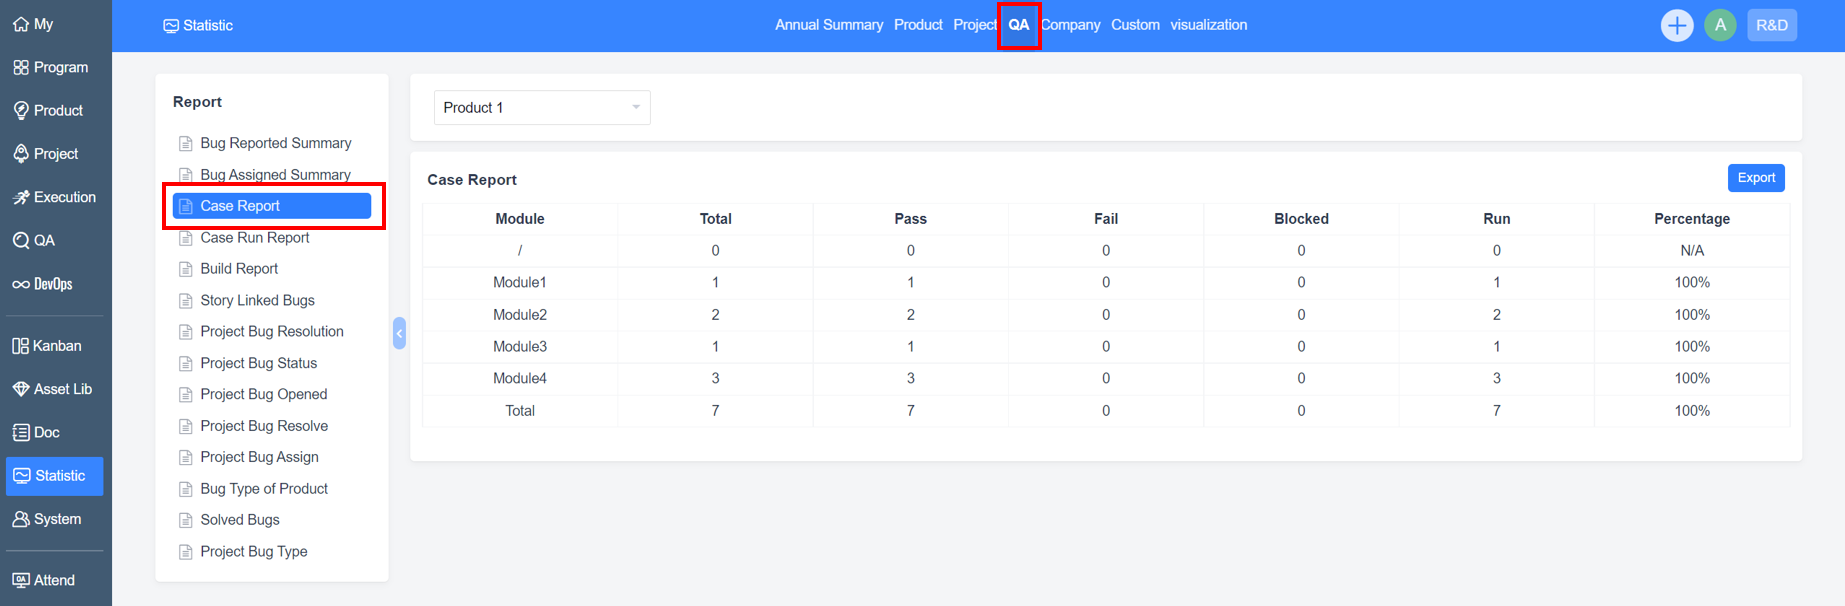
Case Report
The Case Report in "Statistics" - "QA" allows you to count the number of cases, the result of case execution (Run), and the pass rate of cases (Percentage).
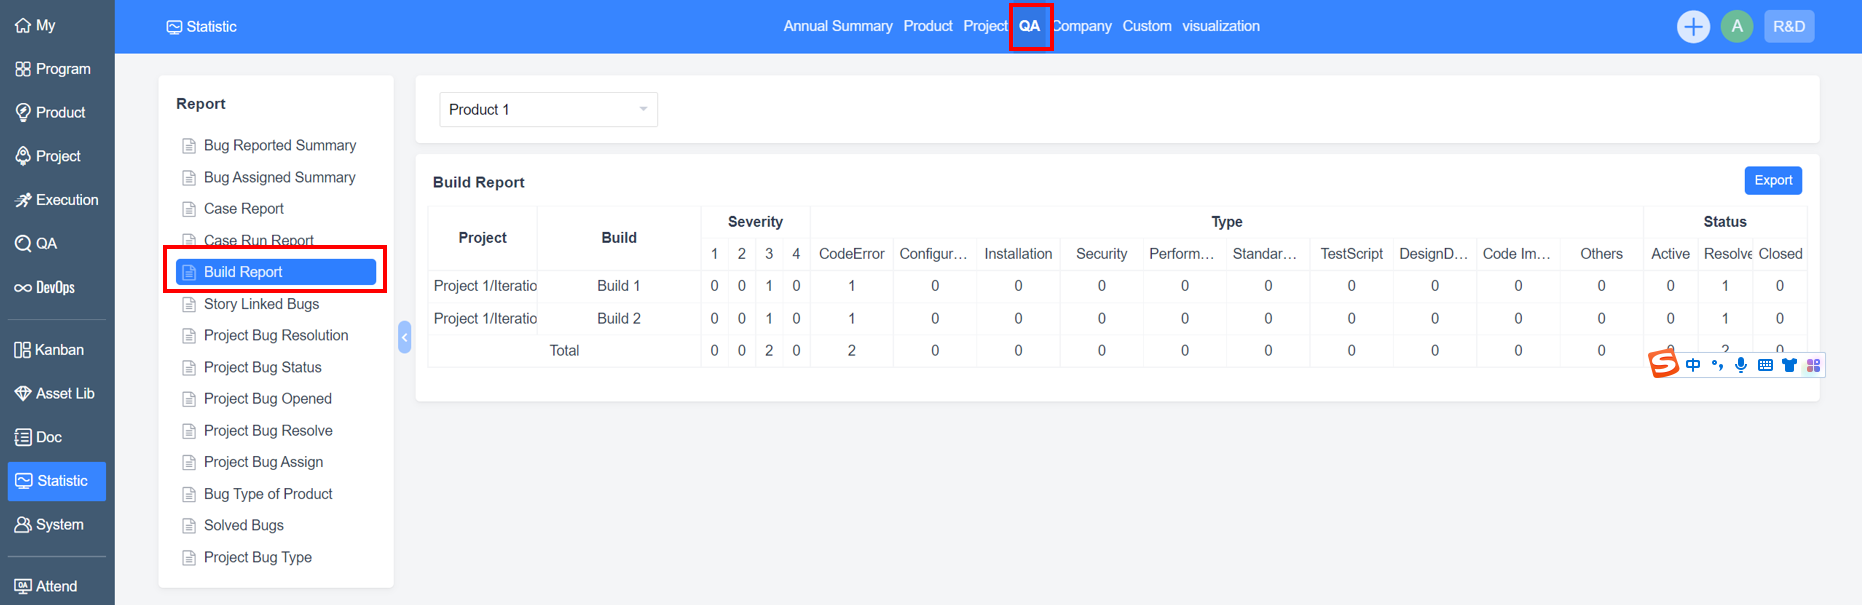
Build Report
The Build Report in "Statistics" - "QA" allows you to count the data of each build.
Reports Export
ZenTao Biz can export reports to the local computer. What's more, it supports the export of custom reports and project execution pie charts.

View the reports in "Execution" - "Task", select the data you want to count, and click Create Report.
ZenTao also has the Crystal Report (Custom Report). With the Crystal Report, users can write their own Structured Query Language (SQL), design reports based on the query results, and then generate the required reports. This function is very powerful and flexible. In the "Statistic" section, there are some built-in reports that can be used directly or as a reference to be modified on this basis.