
Lead Time vs Cycle Time in Agile: The Difference
2 hours agoPUBLISHED INAgile
 ali
ali 2026-10-06 14:06:00
 0
0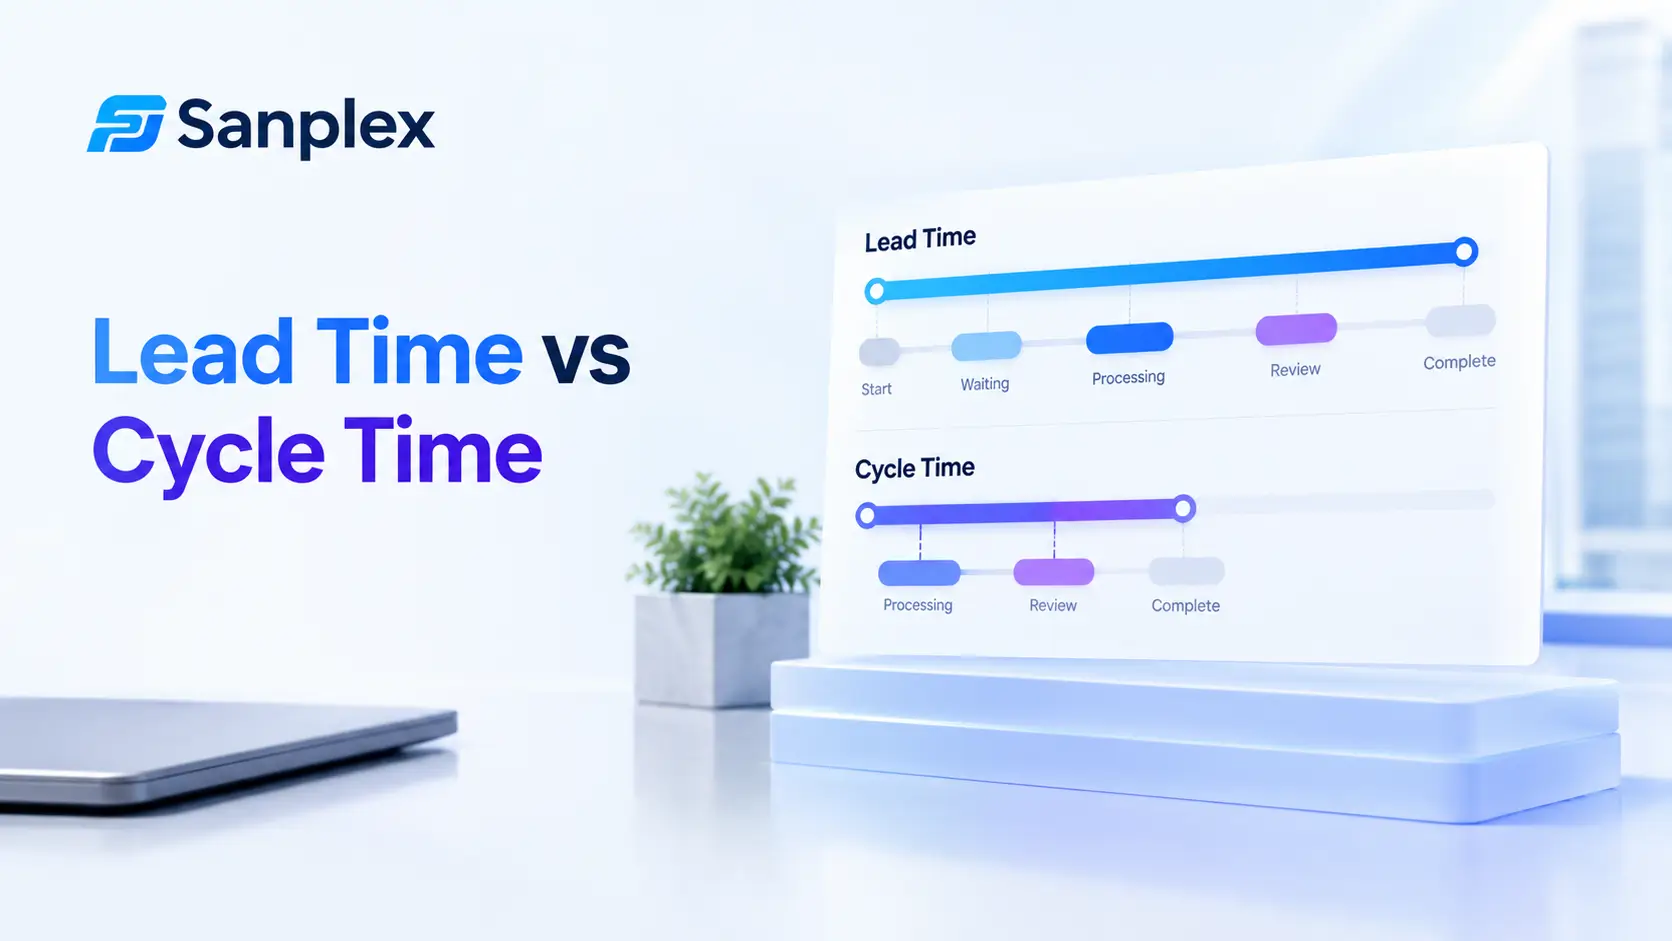
People mix up lead time and cycle time constantly, partly because every tool and every book defines them a little differently. It matters, though. The two numbers tell you different things. One shows how long your customers wait. The other shows how well your team works once it picks something up.
Here's a plain definition of each, a worked example with real dates, and some thoughts on using the numbers without turning them into a stick to beat people with.
What is lead time?
Lead time starts the moment a request enters your system. A ticket gets created, a customer email gets logged, an idea lands in the backlog. It ends when the finished work reaches the person who asked. Everything in between counts, including all the waiting: sitting in the backlog, waiting for a free developer, waiting for the next release.
What is cycle time?
Cycle time starts when somebody actually begins working on the item and ends when the work is done. It leaves out the queue before that. Most teams measure it from In Progress to Done, though what matters is that you write down exactly which two statuses you use, so everybody counts the same way.
A worked example with real dates
Here's an illustrative example for one task, "Add CSV export to the reports page."
|
Event |
Date |
|---|---|
|
Request created |
Tuesday 1 September |
|
Work starts |
Tuesday 8 September |
|
Work done, tested and merged |
Friday 11 September |
|
Released to customers |
Tuesday 15 September |
Working out the numbers
-
Lead time: 1 September to 15 September, so 14 days
-
Cycle time: 8 September to 11 September, so 3 days
-
Waiting before work started: 7 days
-
Waiting for the release after work finished: 4 days
The team was quick. Three days of real work. But the customer waited two weeks, and most of that wait was spent sitting in queues. Watch only cycle time and you'd think everything was great. That gap is exactly why both numbers matter.
Lead time vs cycle time at a glance
|
Lead time |
Cycle time |
|
|---|---|---|
|
Starts |
When the request is made |
When work begins |
|
Ends |
When it's delivered |
When work is done |
|
Includes queues |
Yes |
No |
|
Whose view |
The customer's |
The team's |
|
Helps you improve |
Prioritization, flow, release process |
Work size, blockers, team efficiency |
Why the difference matters
Long lead time, short cycle time
Your problem is waiting. Look at how work gets prioritized, how many items are in progress at once, and how often you release. Speeding up the developers won't help here.
Long cycle time
Now the problem is inside the work. Big stories, slow reviews, handoffs, blockers. That's where to dig.
A handy rule of thumb
There's a neat relationship, often called Little's Law. Average cycle time is roughly the work in progress divided by throughput. In plain terms, if you work on fewer things at once, things finish sooner. It sounds too simple, and it still works.
How to shorten lead time
Reduce work in progress
The easiest win. When everybody juggles five things, nothing finishes. Cap the number of items per person or per column and watch the queues shrink.
Make stories smaller
Small items flow through faster and are easier to review, test and release. If a story takes more than a few days, it's a candidate for splitting.
Release more often
In our example, work sat finished for four days waiting for a release. Releasing twice a week instead of once would have cut that wait in half, with no extra effort from the developers.
Clear the waiting at the start
A week in the backlog before anyone touched the task was the biggest single delay. Look at how you prioritize. Items that nobody will ever work on shouldn't sit in the queue pretending otherwise.
How to use these metrics well
Track a spread, not just an average
"85 percent of our items finish within six days" is far more useful for forecasting than a single average. Averages hide the nasty outliers.
Measure the same way every time
Agree on the start and end statuses, write them down and stick to them. Changing the definition halfway through ruins your trend.
Chart it
A scatter plot of cycle times shows outliers in seconds. Those dots way above the rest are the ones worth talking about in a retro.
Look at trends, not people
These are signals about the system. The moment they become individual scores, people start gaming them.
Mistakes people make when measuring
Counting calendar days when work is paused
A task blocked for a week still counts in cycle time. That's correct, and uncomfortable, and it's the whole point. Hiding blocked time hides the problem.
Mixing different kinds of work
Bug fixes, features and small chores behave differently. Look at them separately, or your numbers will be a muddle.
Forgetting the start rule
If half the team moves a card to In Progress when they start thinking about it and half only when they start coding, the data is noise. Agree on the rule.
Where to start this week
-
Pick the two statuses that mark the start and end of cycle time
-
Write down the dates for your last ten finished items
-
Work out lead time and cycle time for each
-
Look for the biggest gap between the two
-
Pick one thing to try for the next two sprints
Ten items is enough to see a pattern. You don't need a perfect system before you begin.
Which approach suits these metrics?
Scrum teams often reach for a burndown chart guide type of view to follow sprint progress, while lead and cycle time really shine for flow based work. Not sure which way your team leans? Read kanban vs scrum. And when you plan a sprint, use your own cycle times to size the work realistically. Our sprint planning best practices show how.
Why managers and stakeholders care
Lead time is the number your stakeholders feel even if they never say its name. When someone asks "how long will this take?" they really mean lead time. They don't care that the developers only needed three days if the request spent a week waiting before that.
Cycle time, meanwhile, helps you give honest forecasts. If most of your items finish within six days of starting, you can say so with some confidence instead of guessing. Stakeholders tend to trust a range backed by data far more than a single confident date that slips.
So when you report these, put both numbers side by side. It shows where the time goes, and it stops conversations about speed from turning into arguments about how hard the team is working.
Getting the dates from Sanplex
Every work item in Sanplex moves through statuses you define, so you've got the dates you need to work out both numbers for your own team. Pick your start and end statuses once, and the rest is simple subtraction. Start with your last ten finished items, and you'll have a real baseline by the end of the day.
Frequently asked questions
What is the difference between lead time and cycle time?
Lead time covers the whole wait from request to delivery, queues included. Cycle time covers only the stretch when the team is actively working on the item. Lead time is the customer's view and cycle time is the team's.
How do you calculate lead time?
Subtract the date the request was created from the date it was delivered. In our example, created on 1 September and delivered on 15 September makes a lead time of 14 days.
Is cycle time always shorter than lead time?
Yes, because cycle time is a slice of lead time. They only match if work starts the moment the request arrives and delivery happens the moment work is done.
What is a good cycle time for an agile team?
There's no universal number, since it depends on the work. A better goal is a cycle time that's stable and predictable, then shortened gradually by cutting work size and blockers.
What is the difference between lead time and takt time?
Takt time is the pace at which you need to finish work to meet customer demand, and it comes from manufacturing. Lead time is how long a single item actually takes from request to delivery. They're related, but they measure different things.
Can I use lead time and cycle time in Scrum?
Yes. They're more common in Kanban, but Scrum teams can track them too, to spot slow stages and size sprint commitments more realistically.
|
See where your work really waits Define your statuses in Sanplex and measure your own lead and cycle times. Start free. Start with Sanplex |
Related Blogs

How to Write SMART Goals for Project Teams (Examples)