
Catalog
Feature Overview
The Report feature in Waterfall projects provides weekly reports and milestone reports to help teams monitor project progress, schedule performance, cost performance, and overall project status.
The feature integrates Earned Value Management (EVM) to evaluate project performance by comparing planned work, completed work, and actual cost. Through key indicators such as PV (Planned Value), EV (Earned Value), AC (Actual Cost), SPI (Schedule Performance Index), and CPI (Cost Performance Index), project teams can better understand project execution status and make informed decisions.
Use Cases
- Project progress tracking: Weekly reports provide visibility into project progress, completed work, and current project status.
- Milestone monitoring: Milestone reports help teams evaluate progress and performance at important project checkpoints.
- Schedule and cost analysis: EVM metrics help project managers identify schedule deviations and cost efficiency trends.
- Project performance management: SPI, CPI, SV, and CV indicators provide quantitative support for project monitoring and improvement.
I. Project Reports and Milestone Reports
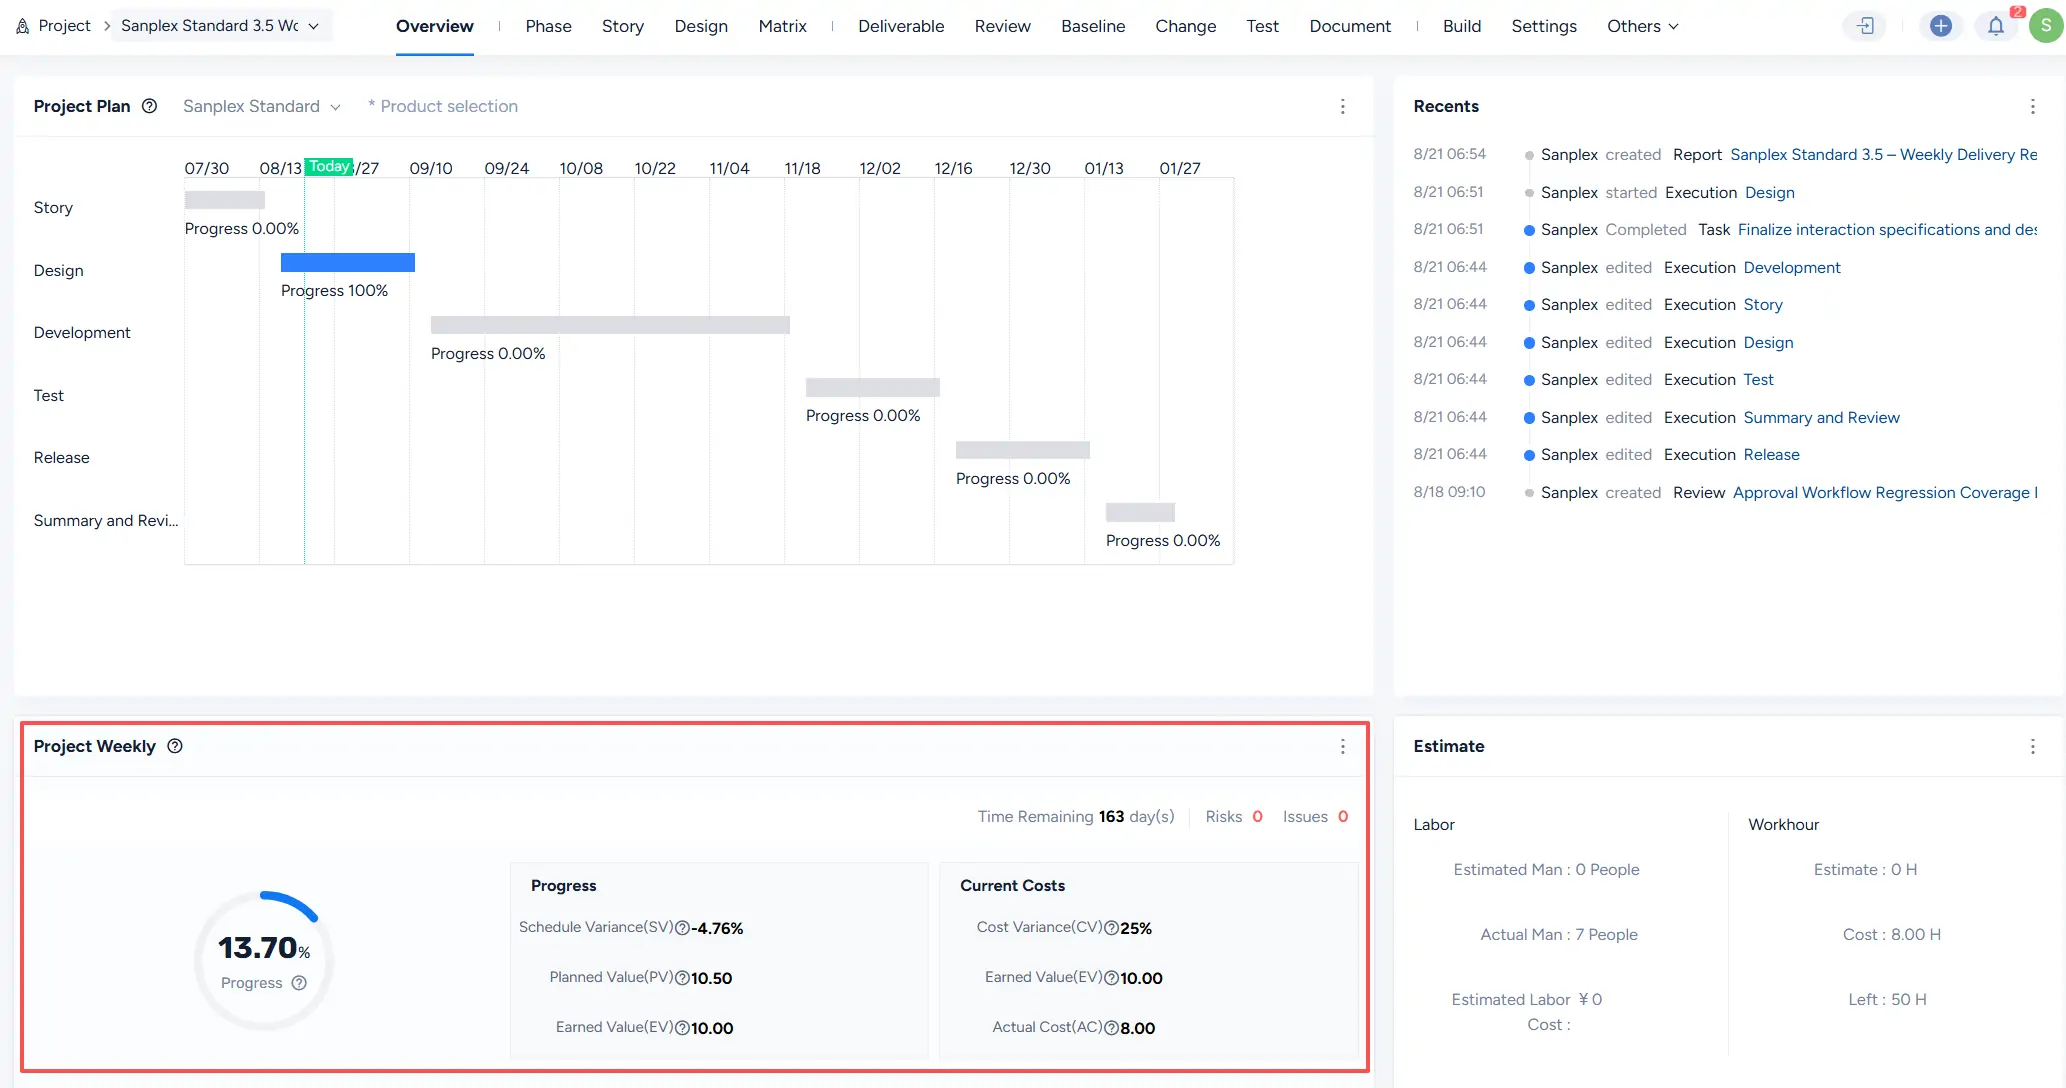
In Project > Overview, you can view the project dashboard, including project progress and related reports.
You can also access project reports from Project > Report to view available reports.

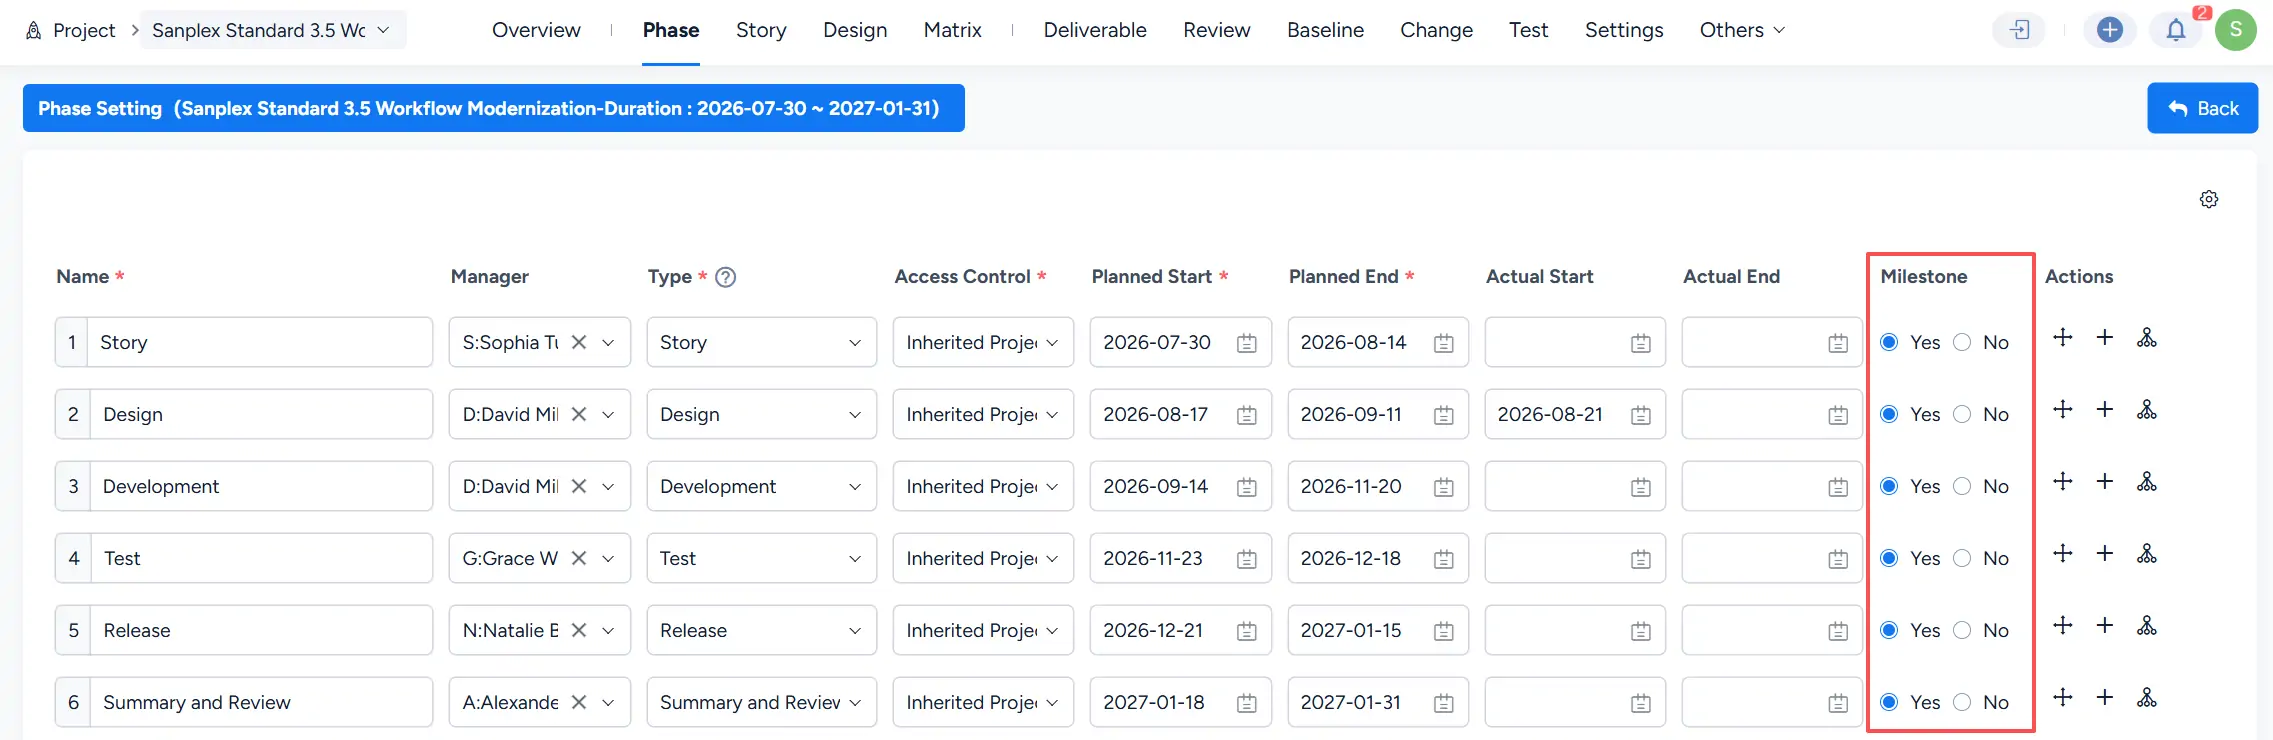
If a project phase is configured as a milestone in Project > Phase, the corresponding milestone report can be viewed in the report list.
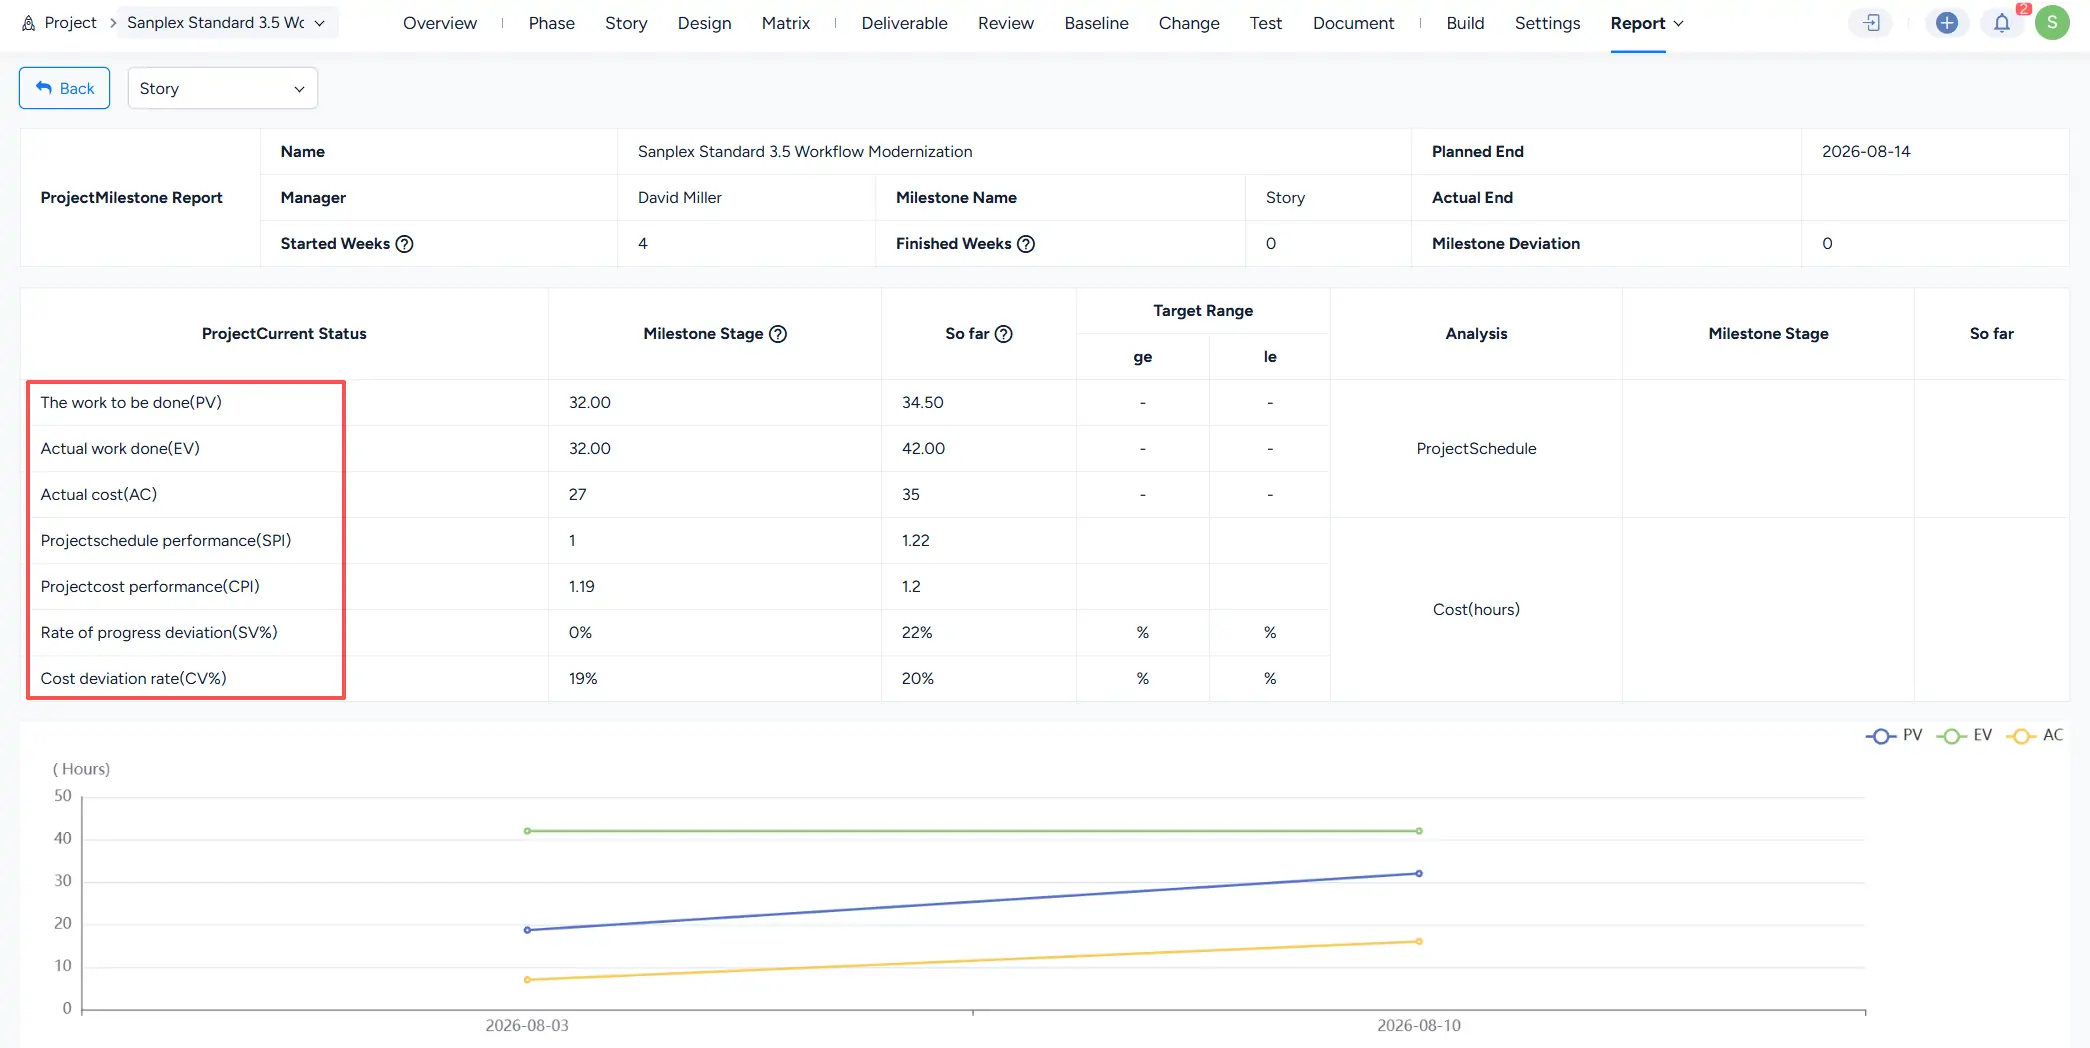
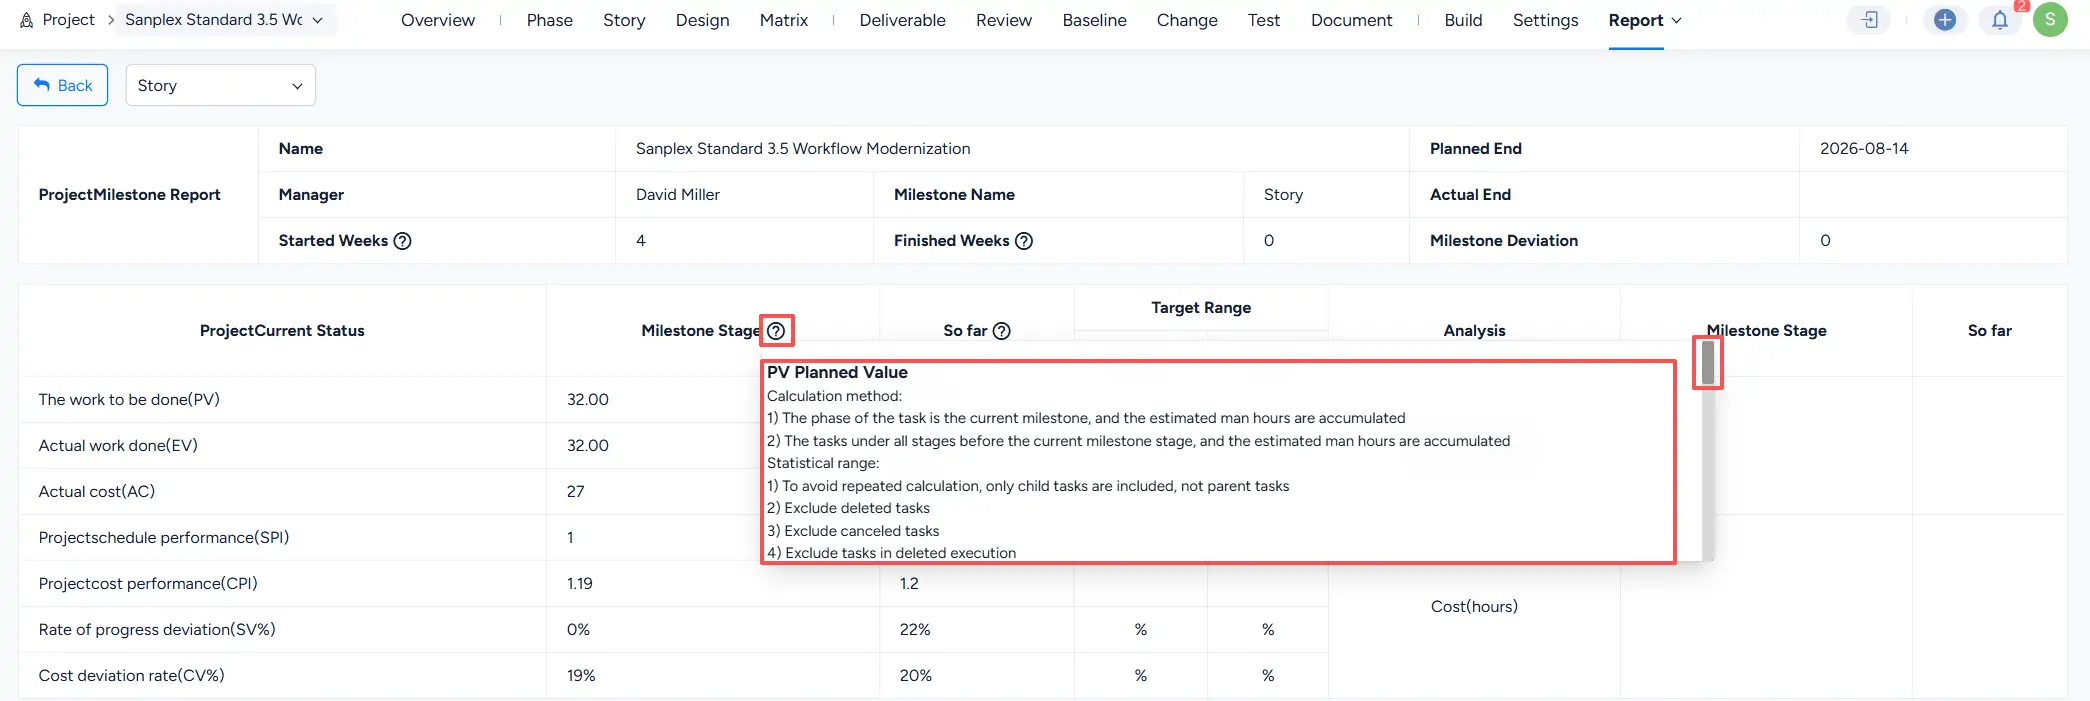
Click a milestone report to view detailed milestone performance information, including planned value, earned value, actual cost, and related performance indicators.

II. Earned Value Management in Waterfall Projects
Earned Value Management (EVM) is used in project reports to evaluate project performance by comparing planned progress, completed work, and actual cost.
The following EVM concepts and metrics are used in weekly reports and milestone reports.
1. Key EVM Concepts
1.1 PV — Planned Value
The value of work planned to be completed at a specific point in time.
1.2 EV — Earned Value
The value of work actually completed at a specific point in time.
1.3 AC — Actual Cost
The actual cost incurred for completed work at a specific point in time.
1.4 SPI — Schedule Performance Index
Measures schedule efficiency by comparing earned value with planned value.
Formula: SPI = EV / PV
1.5 CPI — Cost Performance Index
Measures cost efficiency by comparing earned value with actual cost.
Formula: CPI = EV / AC
1.6 SV — Schedule Variance
Measures the difference between completed work and planned work.
Formula: SV = EV - PV
1.7 CV — Cost VarianceMeasures the difference between earned value and actual cost.
Formula: CV = EV - AC
2. Calculation Formulas
Using the milestone report as an example, earned value data is calculated based on project work hours.
Hover over the question mark icon next to the milestone stage to view the calculation rules.
III. Related Settings
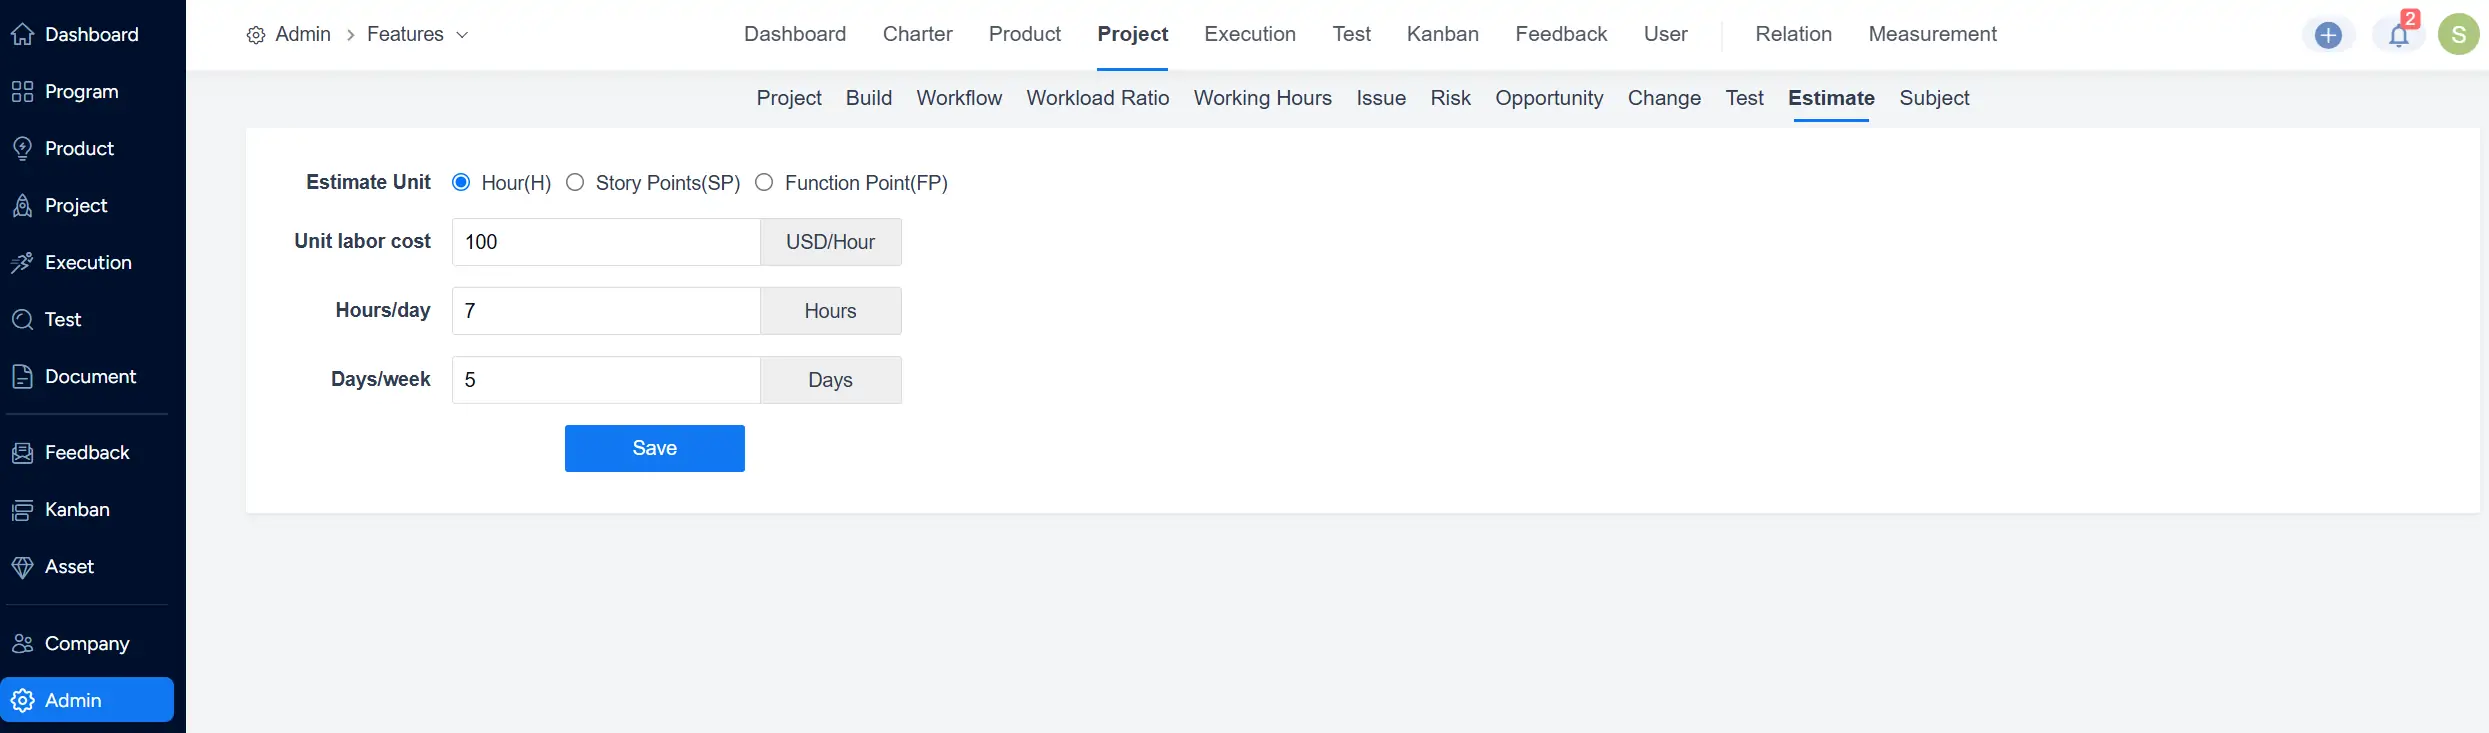
In Admin > Features > Project > Estimate, you can configure project estimation settings, including estimation units, labor costs, working hours, and working days.
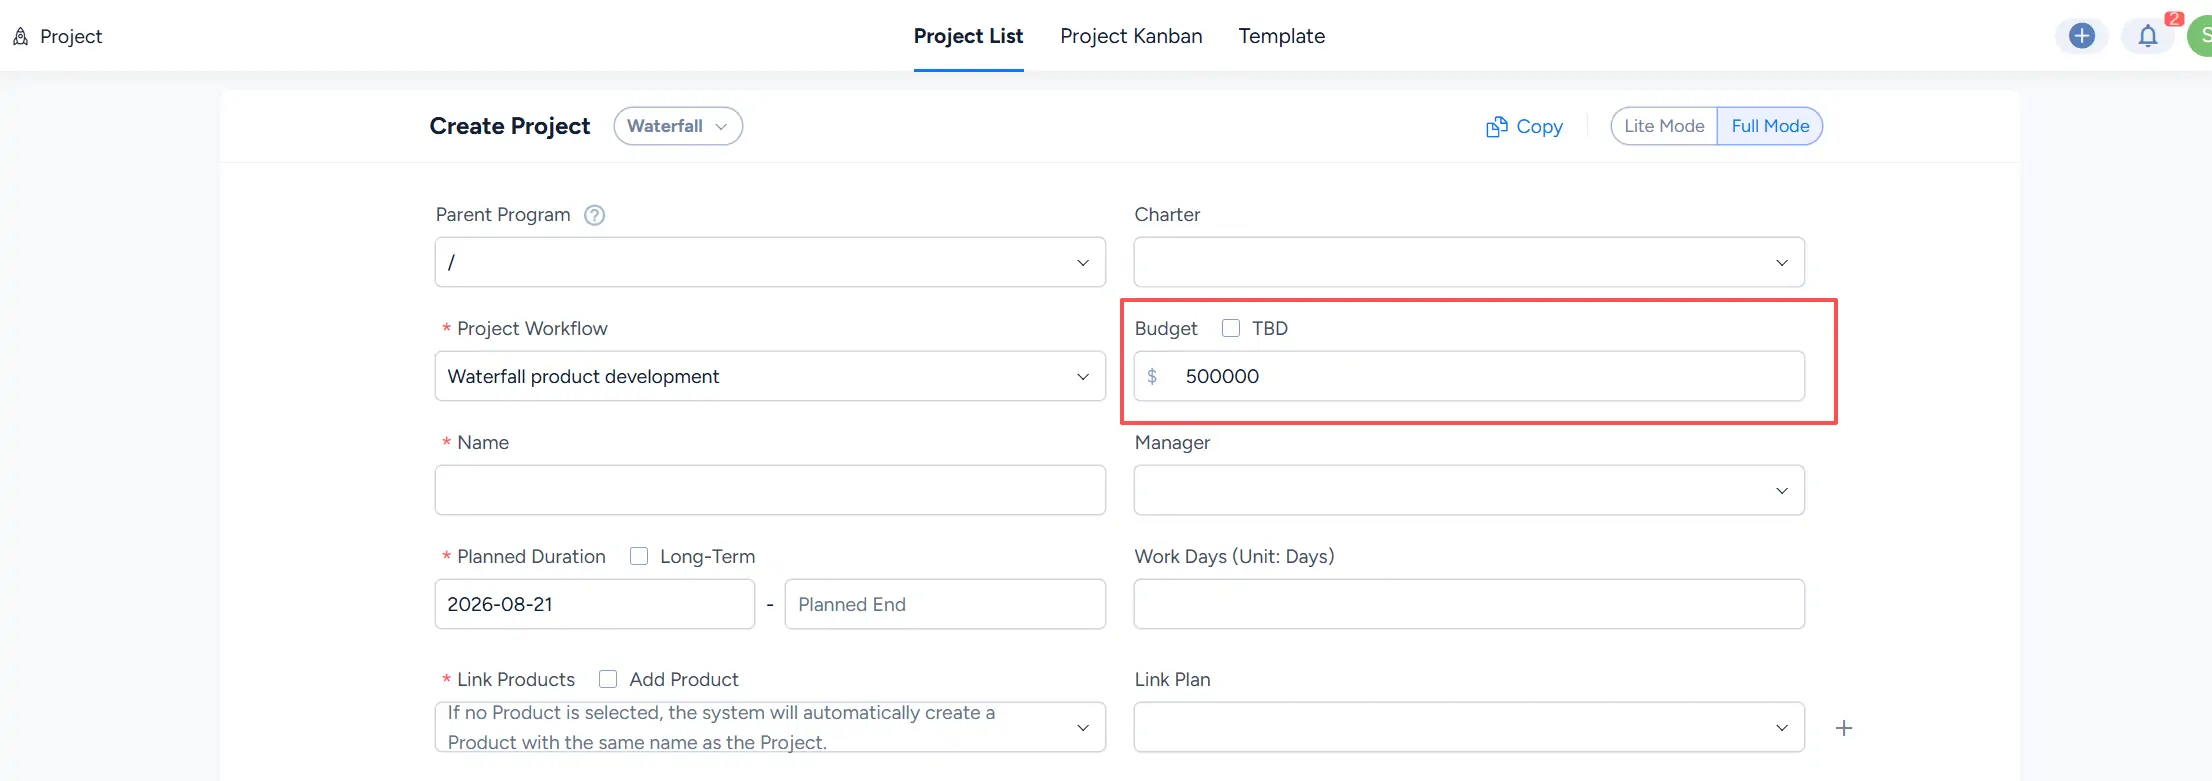
After setting the budget for a program or project, the budget amount can be entered during project creation.
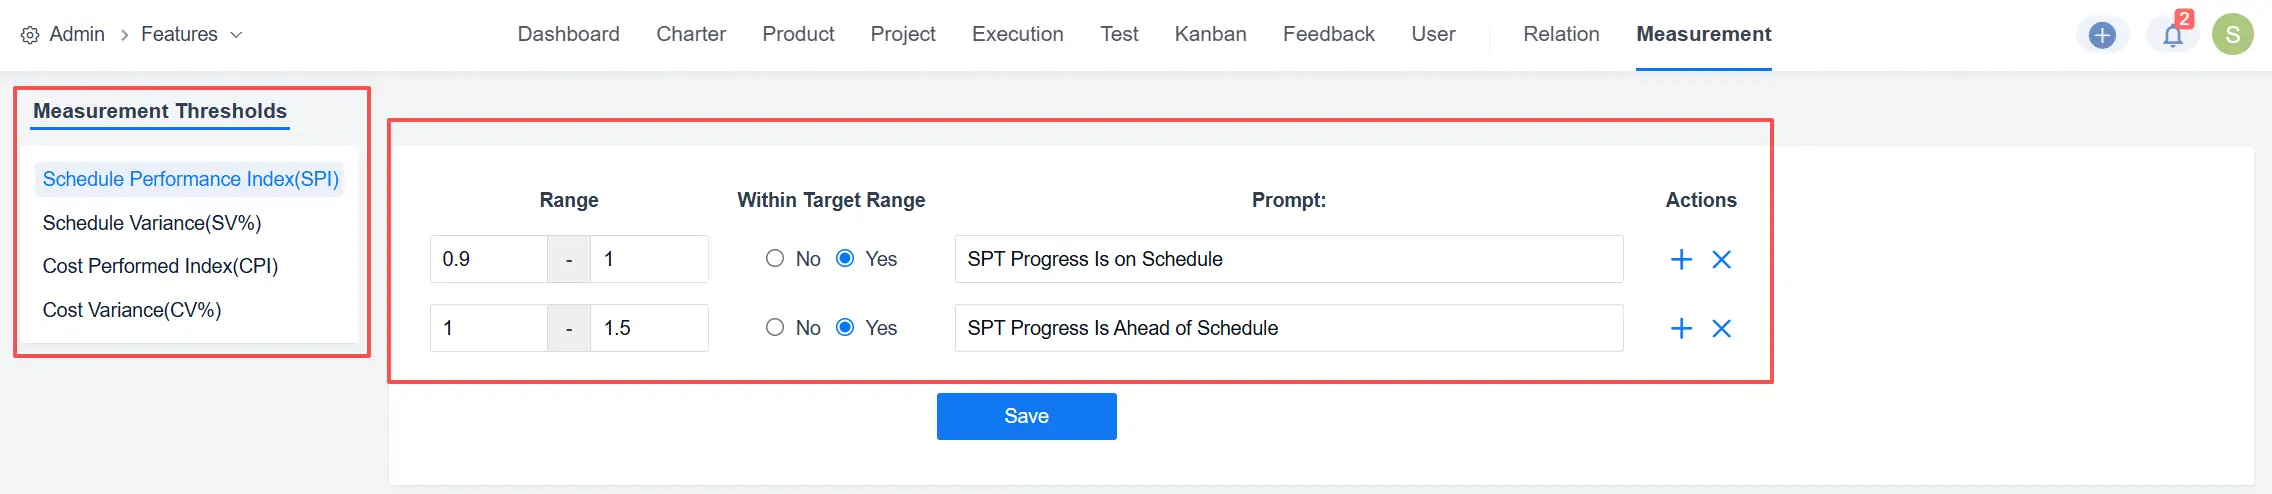
In Admin > Features > Measurement, you can configure target ranges and prompt messages for project performance indicators, including schedule performance and cost performance.