

Catalog
The Project Reports feature allows you to create reports manually and insert current project data directly into report content.
Project reports are organized by category. In addition to custom categories, the current Waterfall + interface includes built-in categories such as monthly report, weekly, daily, and milestone report.
Feature Overview
Project Reports combines manually written content with project data from Sanplex. You can insert properties, lists, measurements, and charts into a report to present project information such as Stories, tasks, bugs, schedules, and other project data.
This makes reports useful for regular status updates, project reviews, milestone summaries, and knowledge capture.
Use Cases
- Team status updates: Project managers can create weekly reports to summarize recent progress, work status, and follow-up items.
- Milestone summaries: Teams can use milestone reports to review key project information at important delivery stages.
- Retrospectives and knowledge capture: Project managers can create reports that combine written analysis with current project data for later review and reference.
I. Report List
1. Report list layout
Go to Project > Report to open the report list.
Report categories are displayed on the left, while reports in the selected category are displayed on the right.
At the top of the report list, you can filter reports by All, Created Today, Created This Week, and Created This Month, or use Search to find a report.
Click Create Report in the upper-right corner to create a report.

2. Categories
2.1 Built-in categories
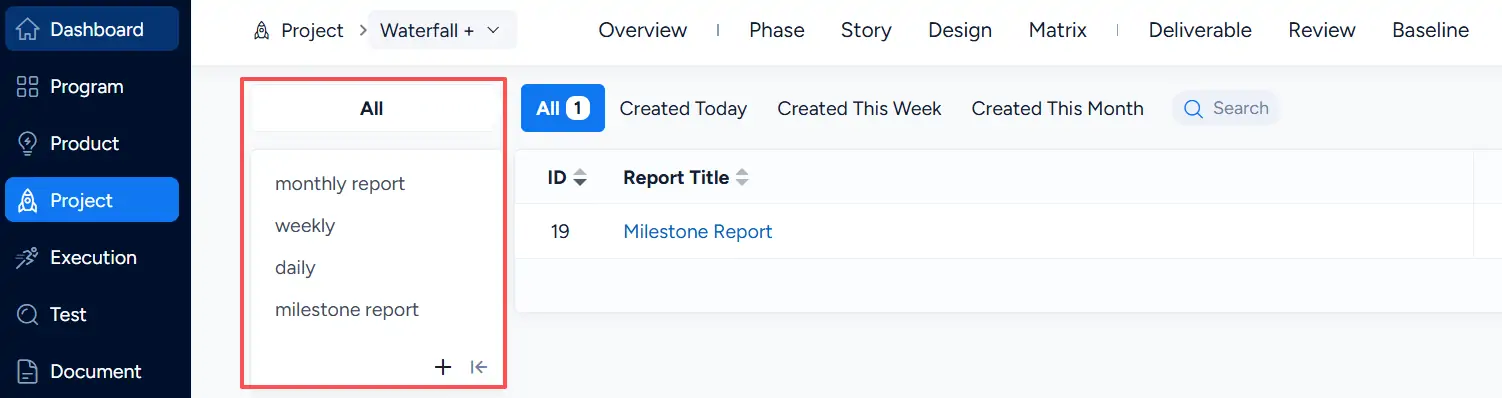
In the Waterfall + project shown below, the report category list includes:
- monthly report
- weekly
- daily
- milestone report
You can also create custom categories for organizing other project reports.
2.2 Create, edit, and delete categories
Click the + icon at the bottom of the category list to create a category.
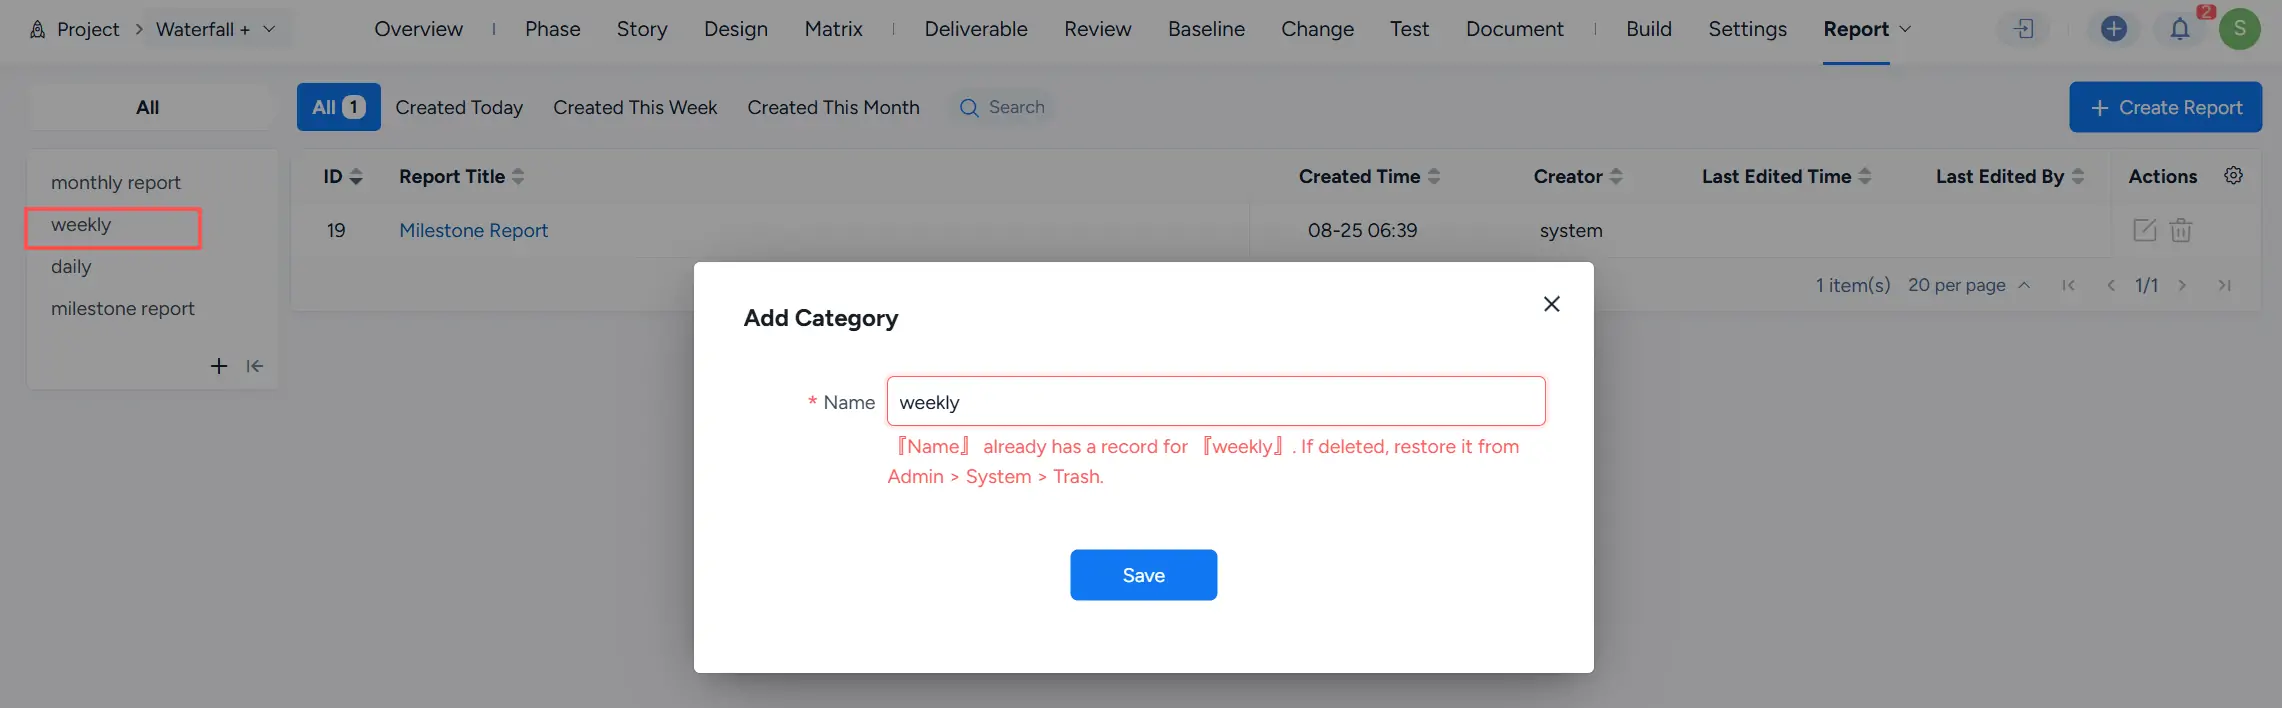
Each category name must be unique. If the same name already exists, Sanplex displays a validation message.
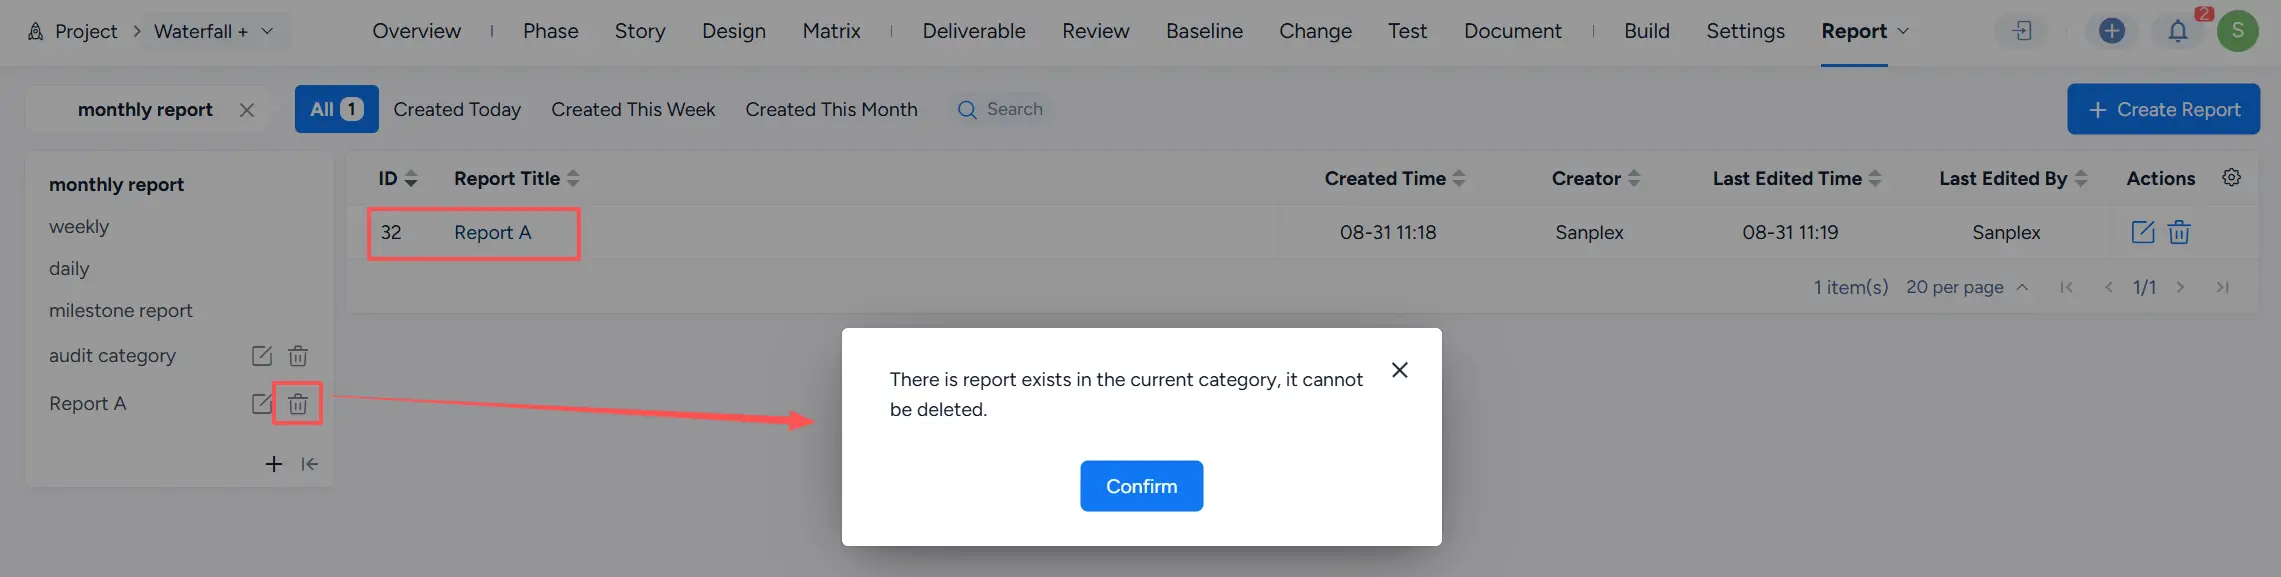
If a custom category already contains reports, the category cannot be deleted while those reports remain in it.
II. Create a Report Manually
1. Create a report
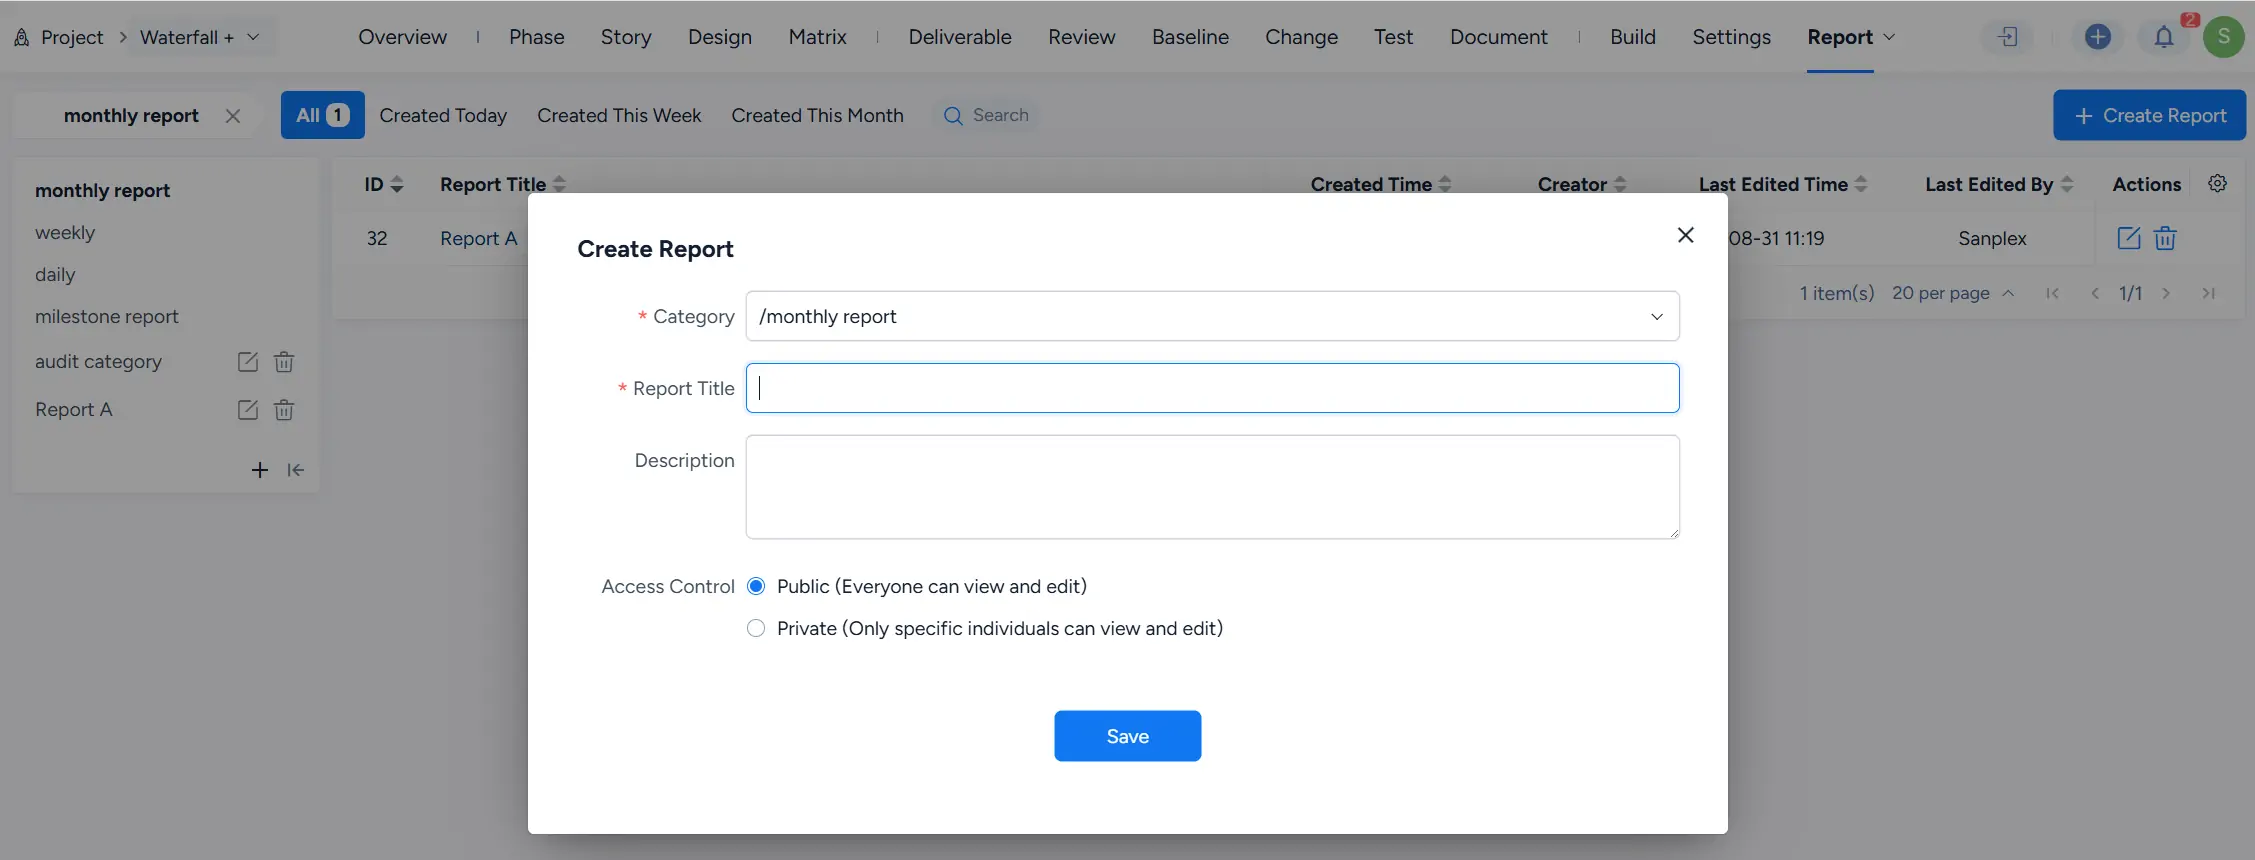
Click Create Report to open the report creation dialog.
Select a Category, enter the Report Title and optional Description, and configure Access Control as required.
Click Save to create the report and open the report editor.
2. Insert system data
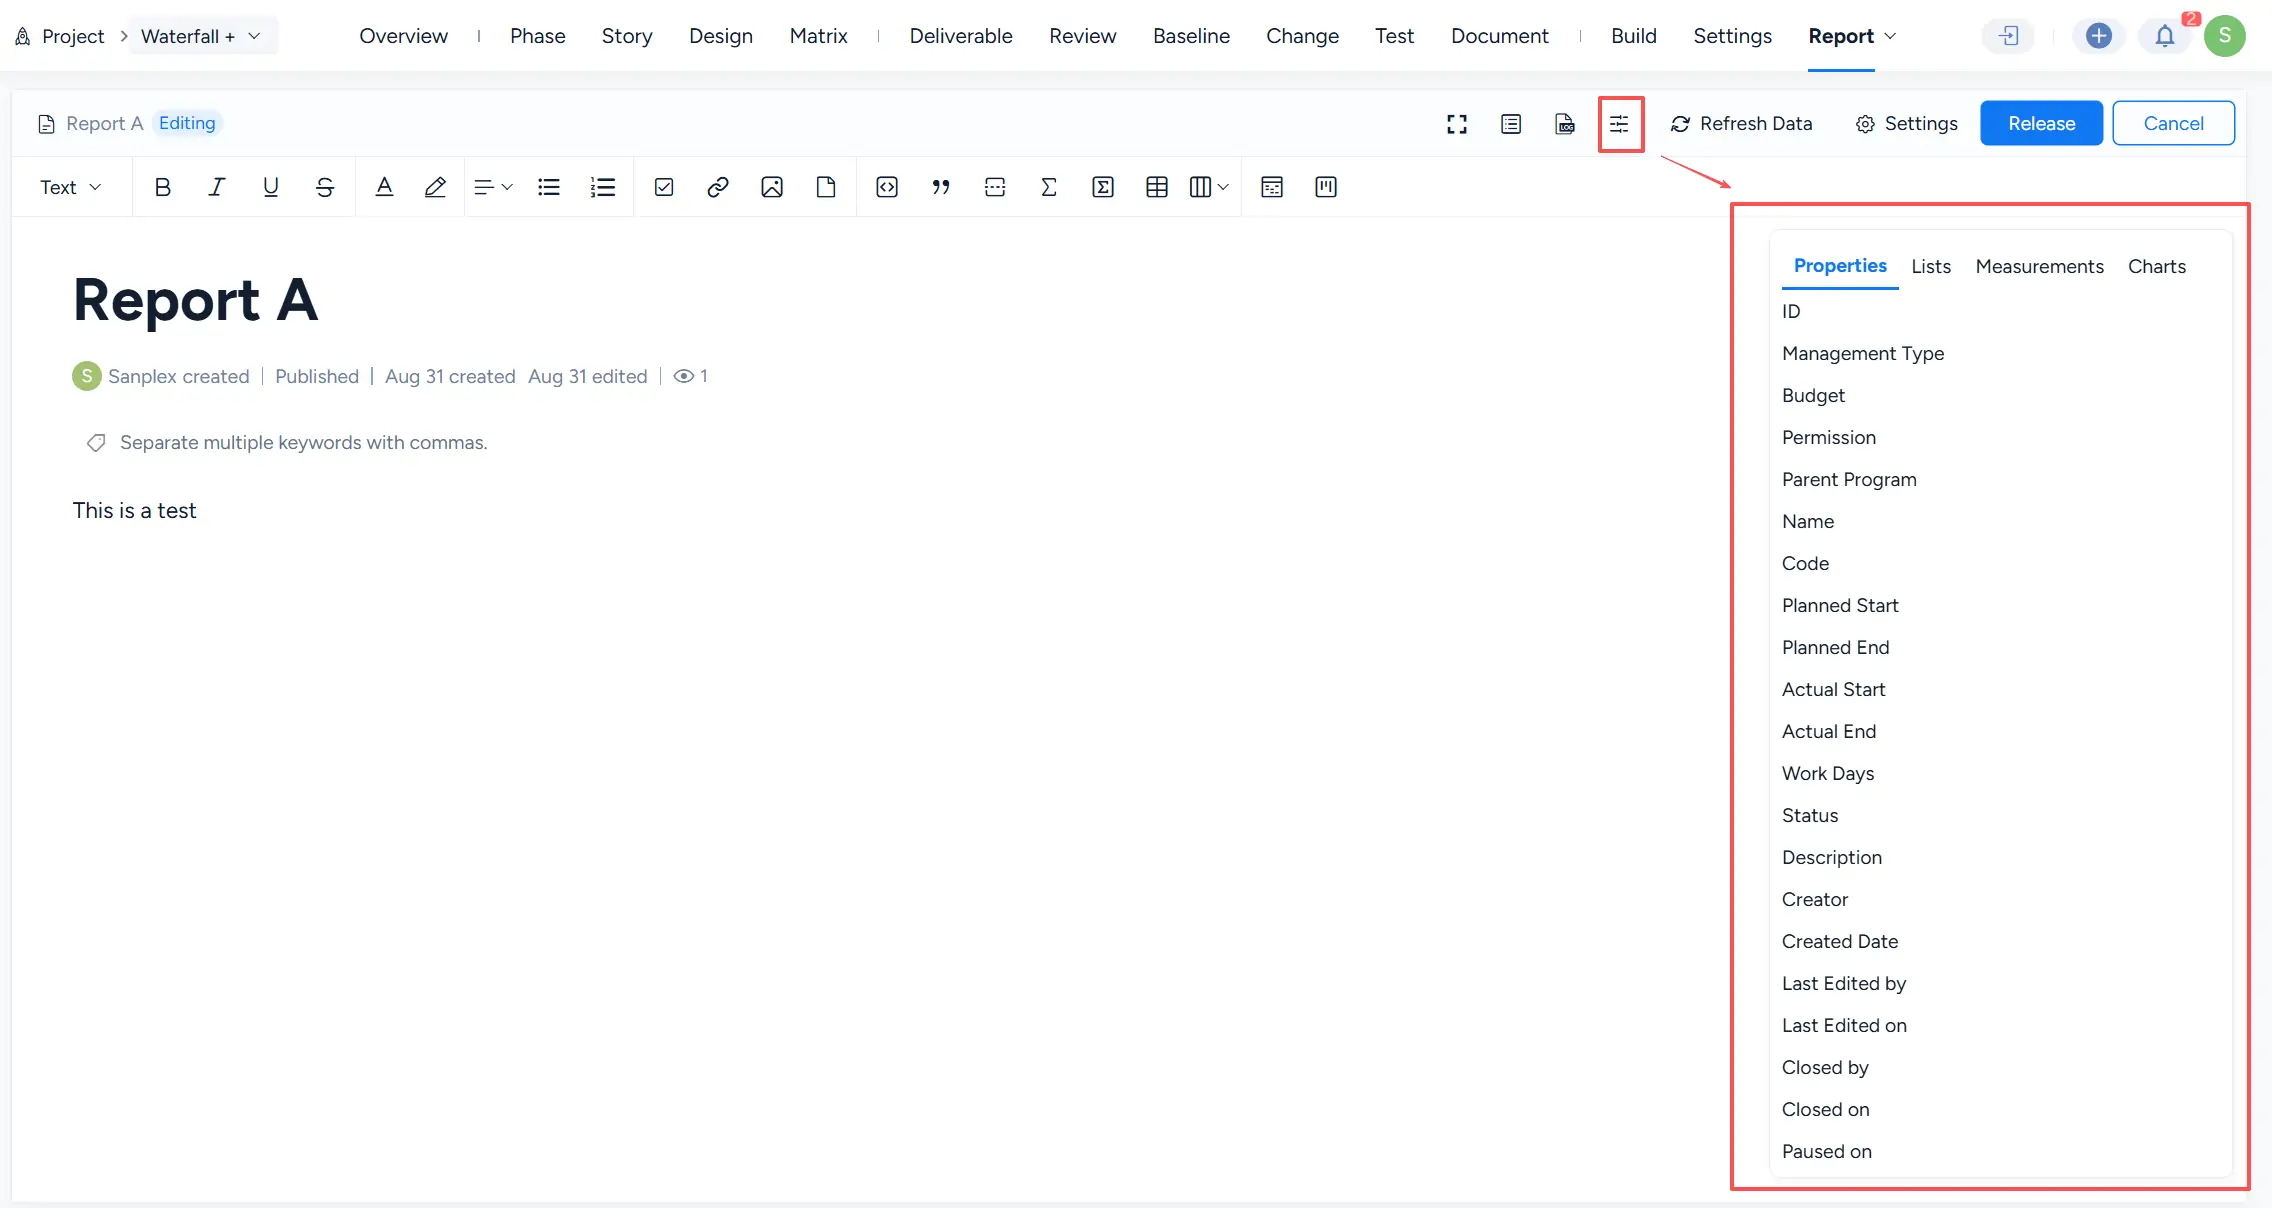
The report editor provides a system data panel that can be opened from the toolbar.
The panel contains four tabs:
- Properties
- Lists
- Measurements
- Charts
Select the appropriate tab based on the type of project data you want to insert.
2.1 Insert properties
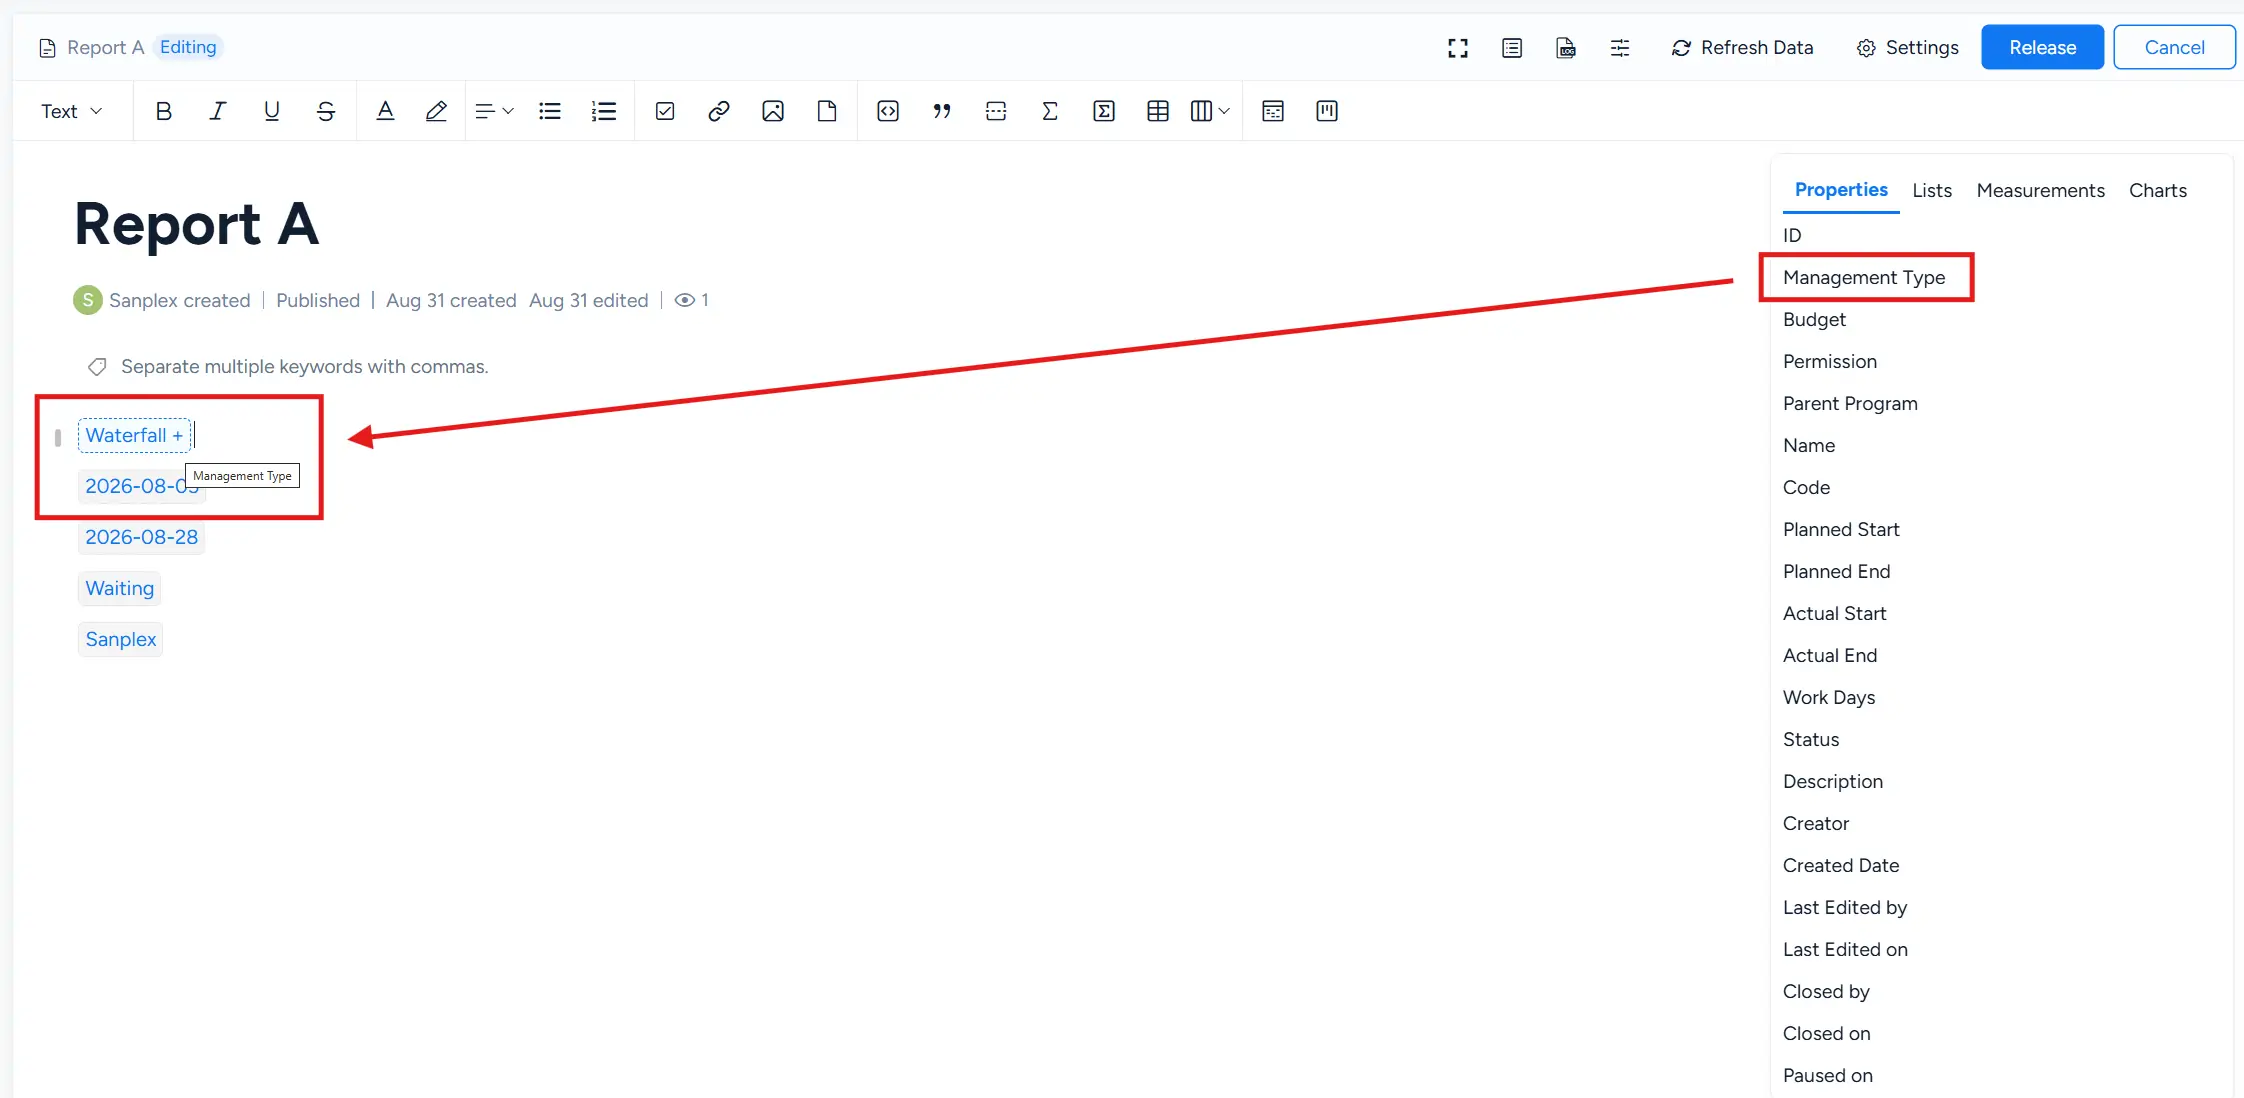
Open the Properties tab and click a property to insert its current value into the report.
For example, selecting Management Type inserts the current project management type into the report body.
2.2 Insert lists
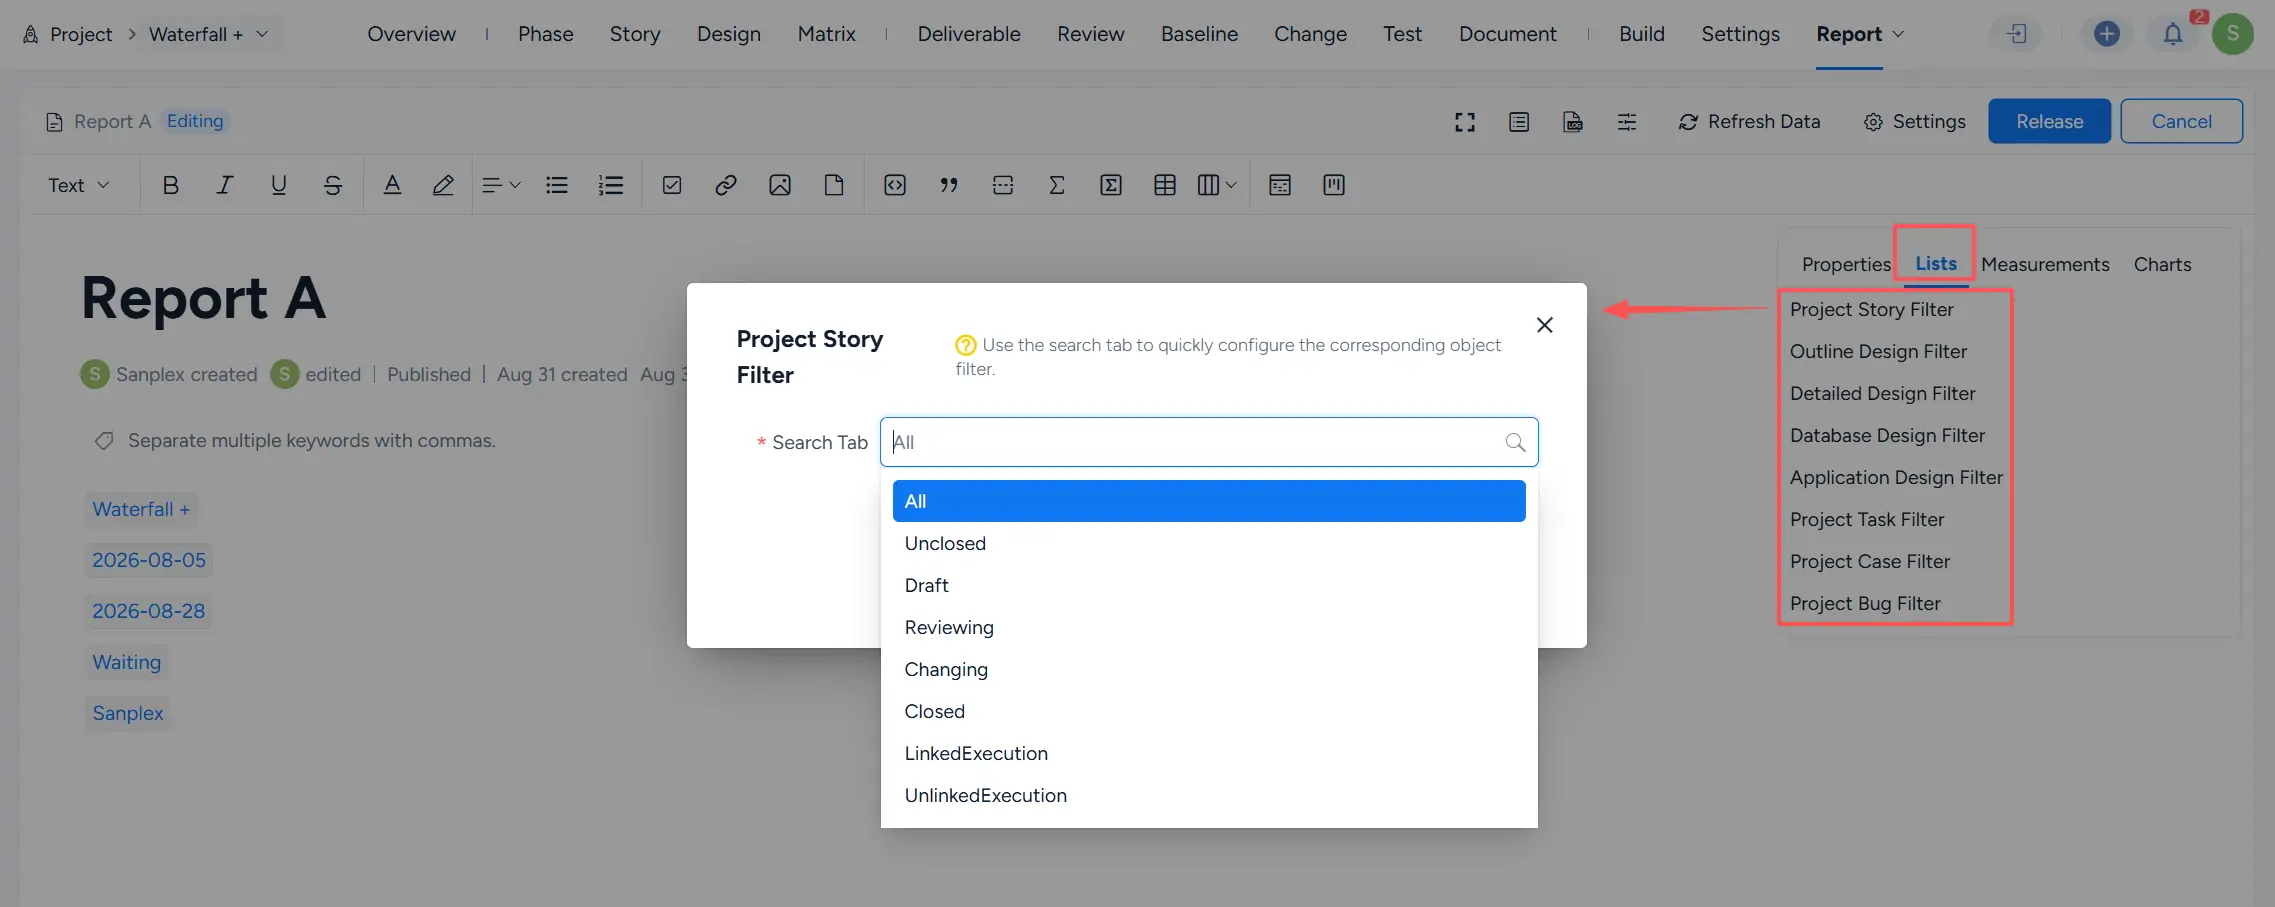
Open the Lists tab and select a list type.
For example, selecting Project Story Filter opens a filter dialog for configuring which Stories should be included.
The Search Tab field can be used to select a Story status or execution-link condition, such as All, Unclosed, Draft, Reviewing, Changing, or Closed.
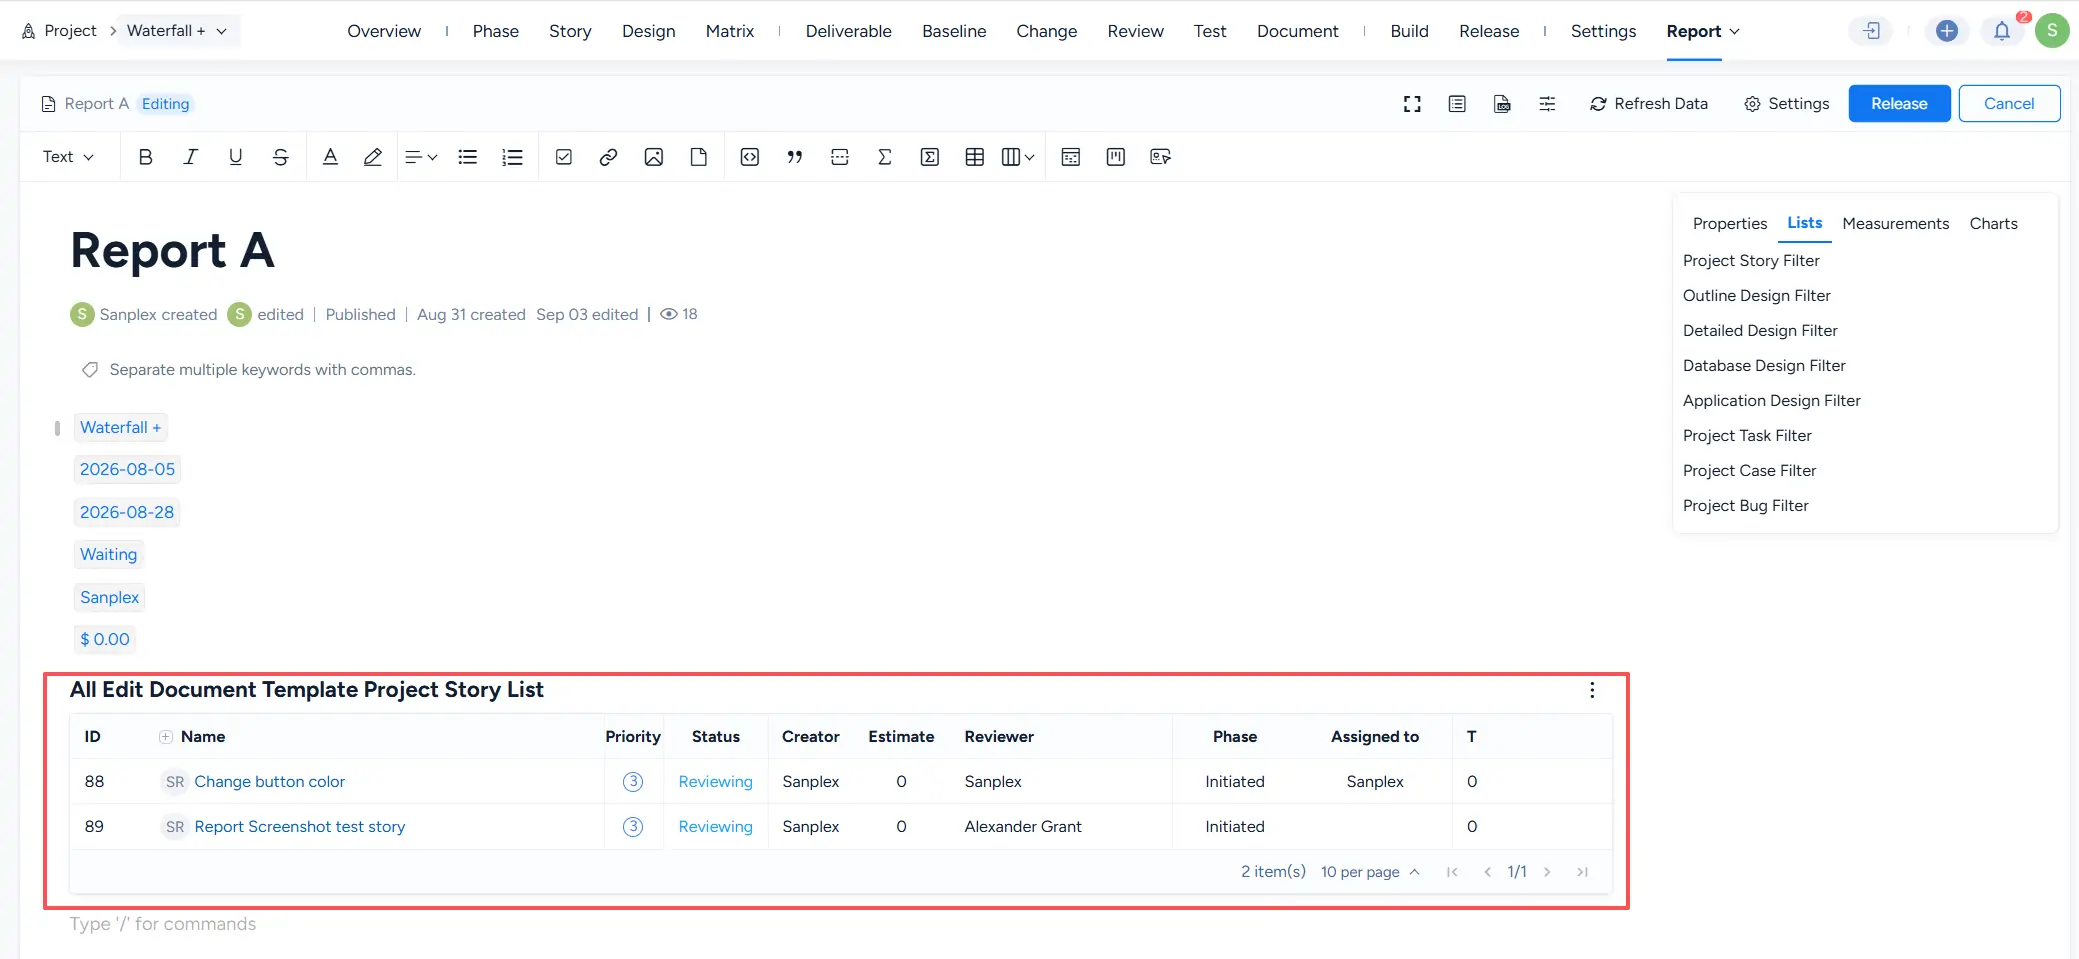
After configuring the filter, save it to insert the matching Story data into the report.
If no project data matches the selected filter conditions, the inserted list displays an empty-state message.
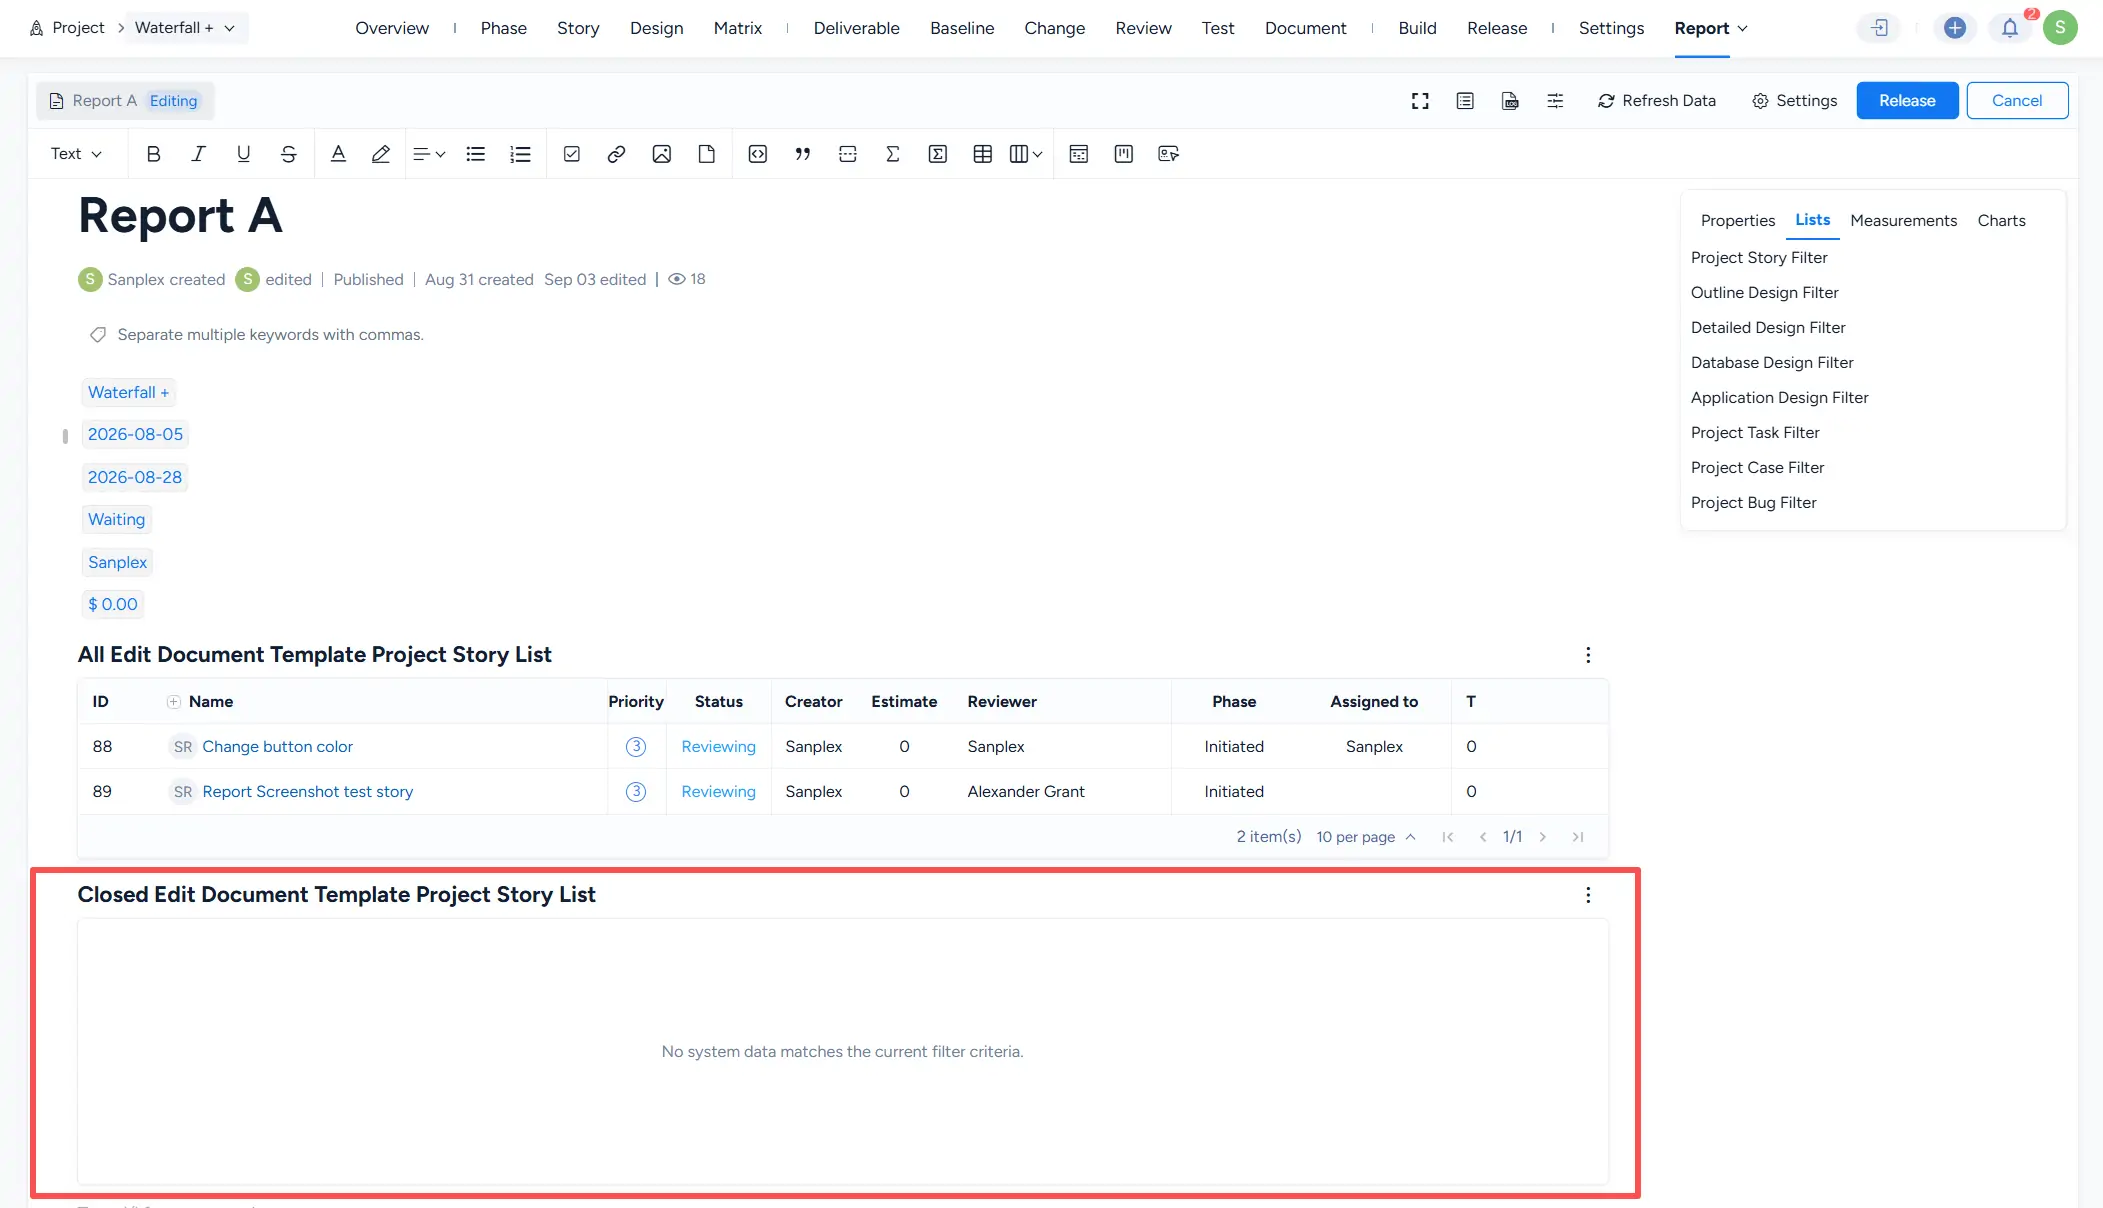
Use the More actions menu on an inserted list to open Settings or Delete the list block.

3. Refresh data
System data inserted into a report reflects the data available when the report content is generated or refreshed.
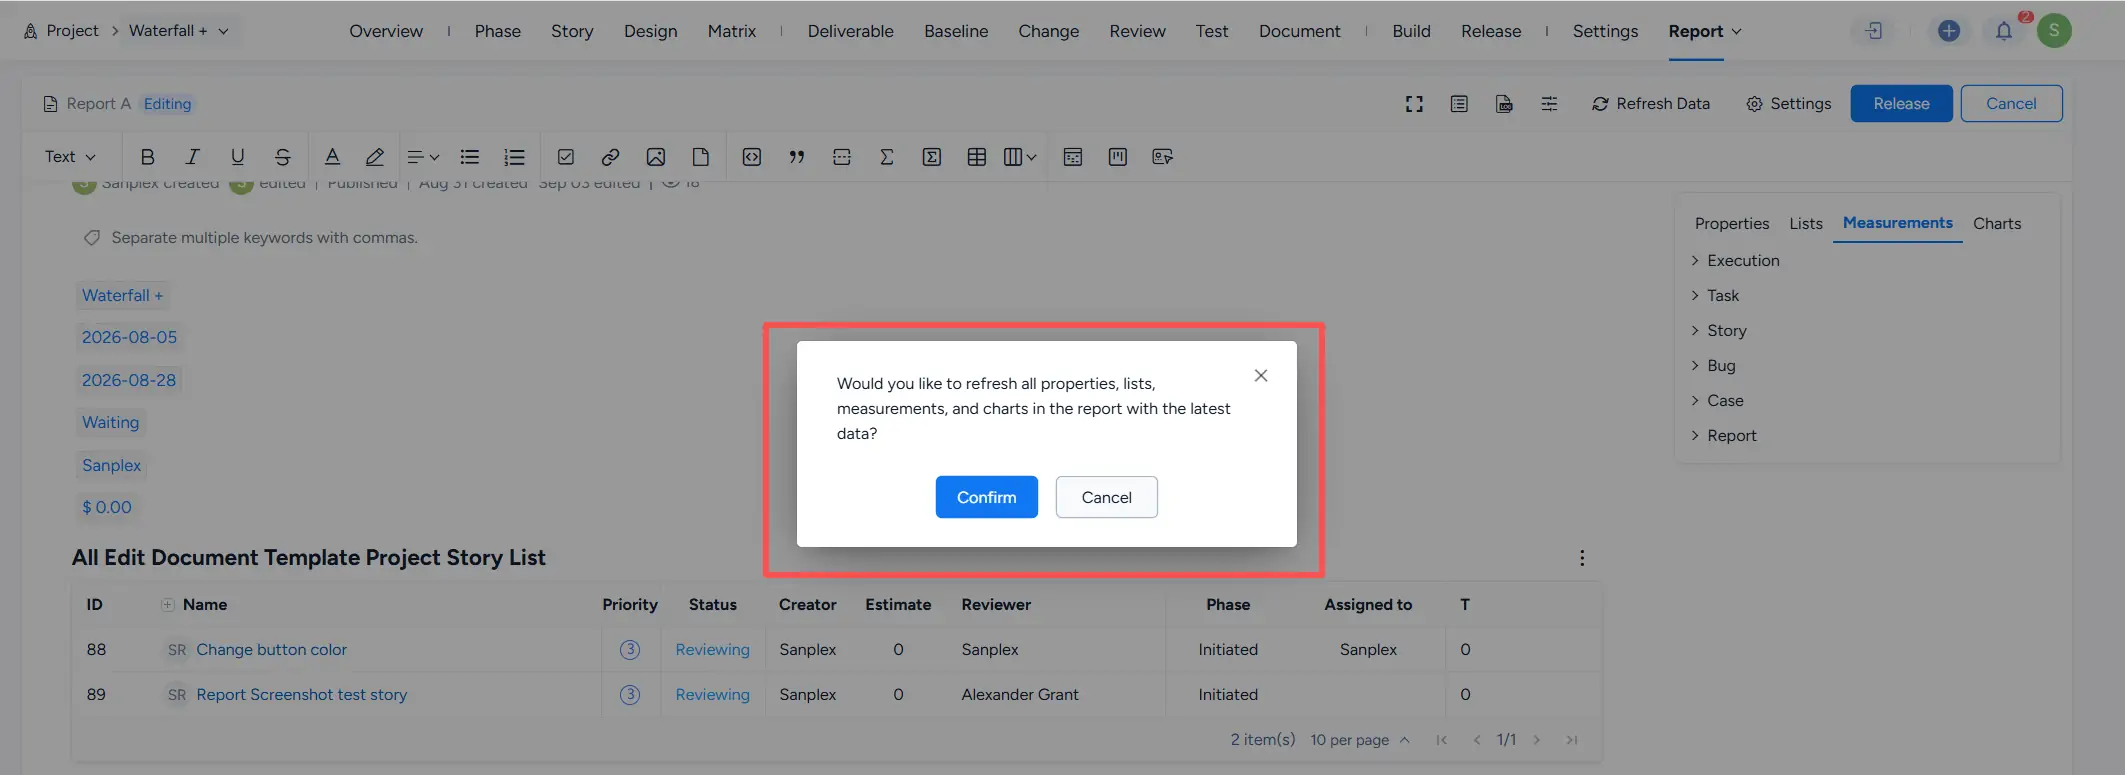
To update the inserted system data with the latest project information, click Refresh Data in the report editor toolbar.

Sanplex asks for confirmation before refreshing the report data.
Click Confirm to refresh the inserted properties, lists, measurements, and charts with the latest available data.
III. Weekly and Milestone Reports
1. Weekly reports
The weekly category can be used to organize reports by reporting period.
For example, weekly reports can use titles such as:
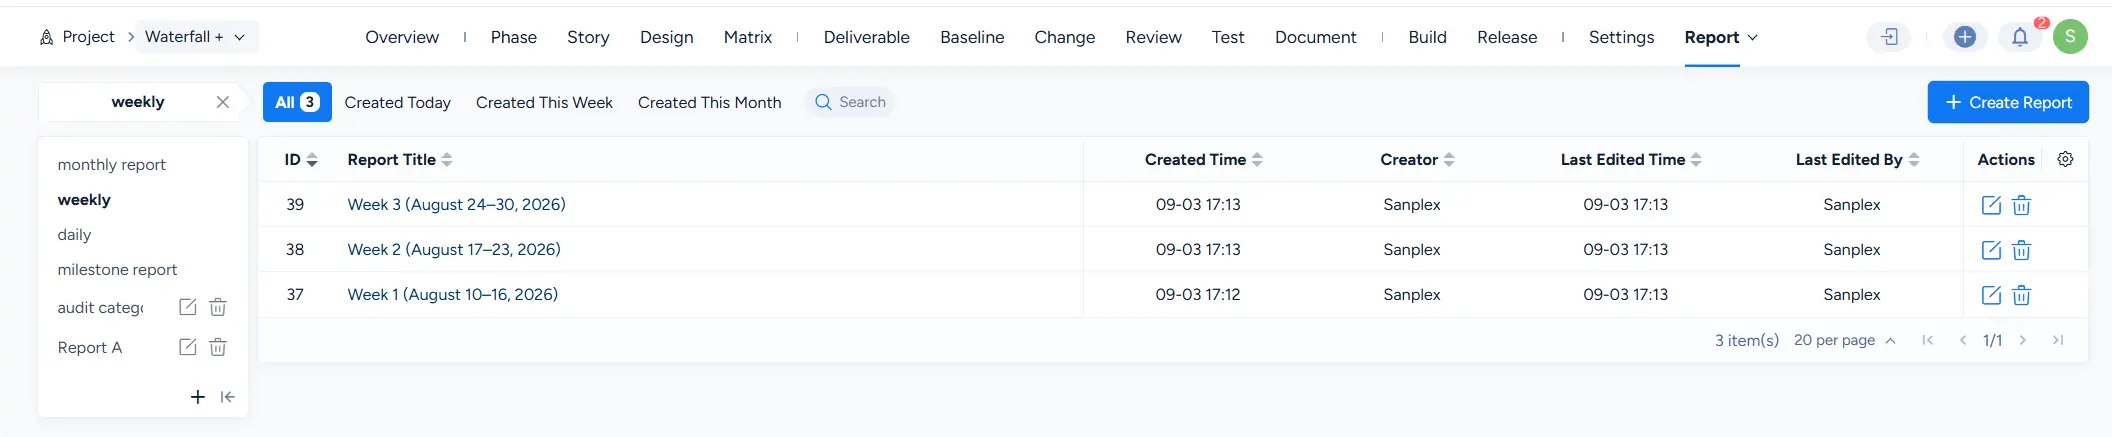
- Week 1 (August 10–16, 2026)
- Week 2 (August 17–23, 2026)
- Week 3 (August 24–30, 2026)
The report list displays information such as the creation time, creator, last edited time, and last editor. Available report actions are shown in the Actions column.
2. Milestone report
Select milestone report from the category list to view the project milestone report.
The current project contains a Milestone Report created by the system.
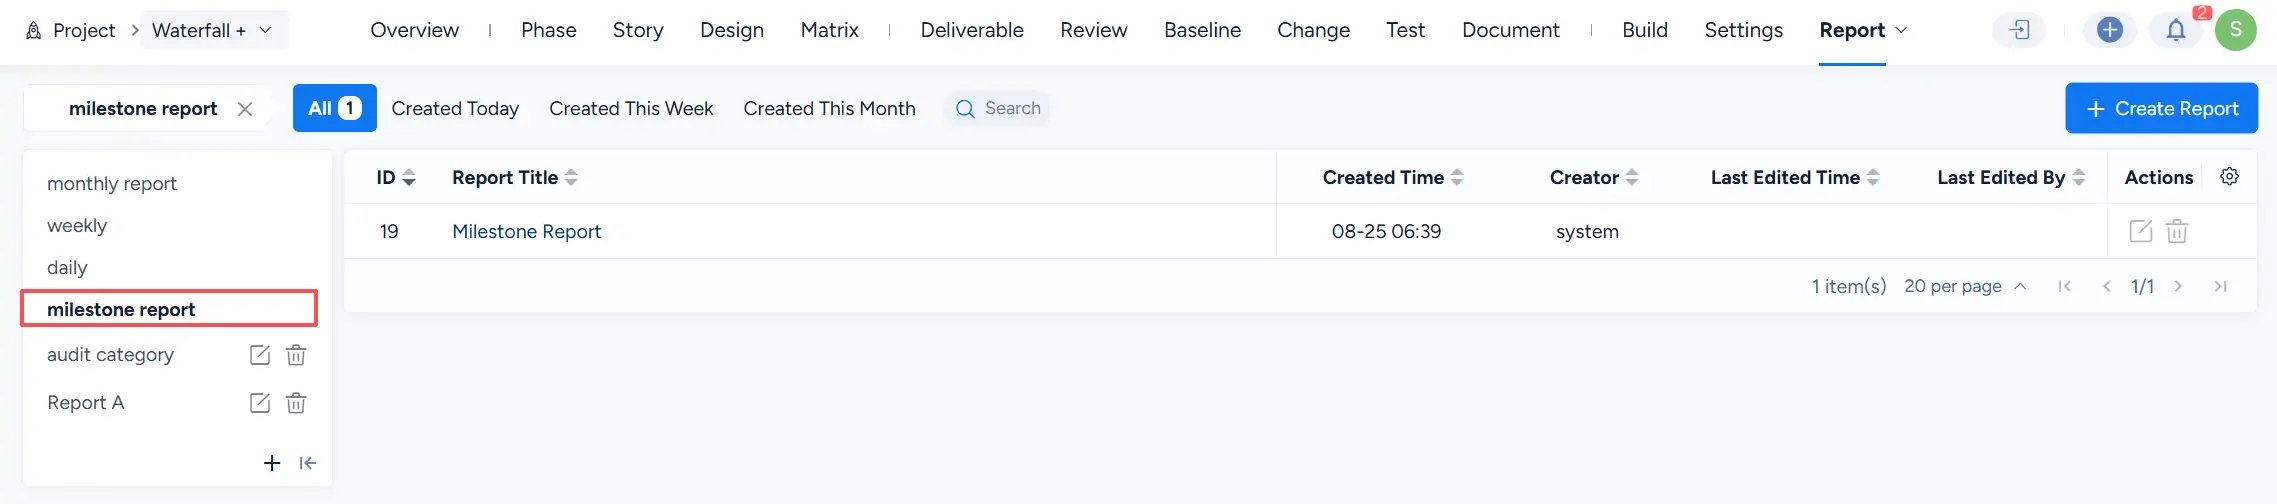
The Milestone Report is managed as a system report. Its Edit and Delete actions are disabled in the report list.